Working with CloudWatch log events in log streams by using the AWS Toolkit for JetBrains
After you've opened the Log Steams pane, you can access the log events in each stream. Log events are records of activity recorded by the application or resource being monitored.
Topics
Viewing and filtering log events in a stream
When you open a log stream, the Log Events pane displays that stream's sequence of log events.
-
To find a log stream to view, open the Log Streams pane (see Viewing CloudWatch log groups and log streams).
Note
You can use pattern matching to locate a stream in a list. Click the Log Streams pane and start entering text. The first log stream name with text that matches yours is highlighted. You can also reorder the list by clicking the top of the Last Event Time column.
-
Double-click a log stream to view its sequence of log events.
The Log Events pane displays the log events that make up the log stream.
-
To filter the log events according to content, enter text in the Filter logstream field and press Return.
The results are log events containing text that's a case-sensitive match with your filter text. The filter searches the complete log stream, including events not displayed on the screen.
Note
You can also use pattern matching to locate a log event in the pane. Click the Log Events pane and start entering text. The first log event with text that matches yours is highlighted. Unlike with Filter logstream search, only on-screen events are checked.
-
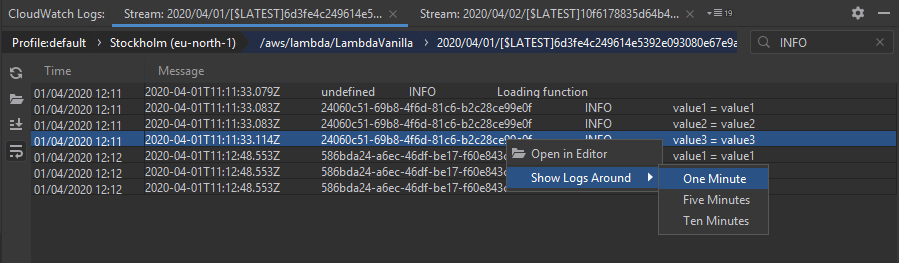
To filter log events according to time, right-click a log event, and then choose Show Logs Around.
You can select One Minute, Five Minutes, or Ten Minutes. For example, if you select Five Minutes, the filtered list shows only log events that occurred five minutes before and after the selected entry.
On the left of the Log Events pane, the log actions offer more ways to interact with log events.
Working with log actions
On the left of the Log Events pane, four log actions allow you to refresh, edit, tail, and wrap CloudWatch log events.
-
To find log events to interact with, open the Log Streams pane.
-
Choose one of the following log actions:
-
Refresh – Updates the list with log events that occurred after the Log Events pane was opened.
-
Open in Editor – Opens the on-screen log events in the IDE's default editor.
Note
This action exports only on-screen log events to the IDE editor. To view all the stream's events in the editor, choose the Export Log Stream option.
-
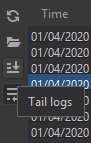
Tail logs – Streams new logs events to the Log Events pane. This is a useful feature for continuous updates on longer-running services such as Amazon EC2 instances and AWS CodeBuild builds.
-
Wrap logs – Displays log event text on multiple lines if the size of the pane hides longer entries.
-
Exporting CloudWatch log events to a file or an editor
Exporting a CloudWatch log stream enables you to open its log events in the IDE's default editor or download them to a local folder.
-
To find a log stream to access, open the Log Streams pane.
-
Right-click a log stream, and then choose Export Log Stream, Open in Editor or Export Log Stream, Save to a File.
-
Open in Editor –Opens the log events that make up the selected stream in the IDE's default editor.
Note
This option exports all events in the log stream to the IDE editor.
-
Save to a File – Opens the Download Log Stream dialog box. This enables you to select a download folder and rename the file containing the log events.
-
