Monitoring Amazon Translate
Monitoring is an important part of maintaining the reliability, availability, and performance of Amazon Translate and your solutions. AWS provides various tools that you can use to monitor Amazon Translate. You can configure some of these tools to monitor your solutions for you. We recommend that you automate monitoring tasks as much as possible.
Amazon Translate provides preconfigured graphs that show you the most important metrics for your solution. Each graph offers a window into your solution's performance. To get different views of how your solution is performing over time, you can change the time range that the graphs show.
You can also use Amazon CloudWatch to monitor Amazon Translate. With CloudWatch, you can automate monitoring specific metrics for your solutions. You receive a notice whenever a metric is outside of the thresholds that you set. You can also use the CloudWatch API to create a custom monitoring application that is suitable for your needs. For more information, see What is Amazon CloudWatch in the Amazon CloudWatch User Guide.
The following table describes each of the preconfigured graphs provided by Amazon Translate.
| Graph | Description |
|---|---|
|
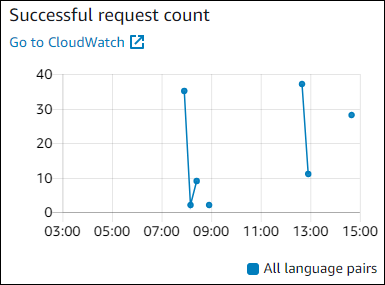
Successful request count The number of successful requests made to Amazon Translate during the specified time period. |

|
Throttled request count The number of requests to Amazon Translate that were throttled during the specified time period. Use this information to determine if your application is sending requests to Amazon Translate too quickly. |
|
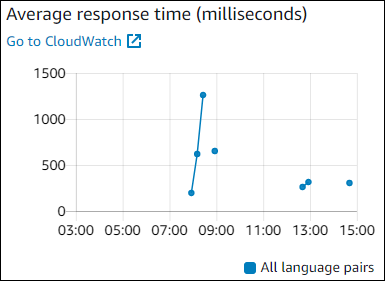
Average response time The average length of time that it took Amazon Translate to process your request during the specified time period. |
|
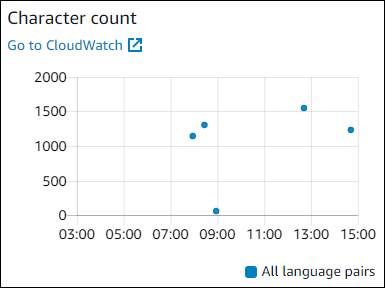
Character count The total number of characters that you sent to Amazon Translate during the specified time period. This is the number of characters that you will be billed for. |
|
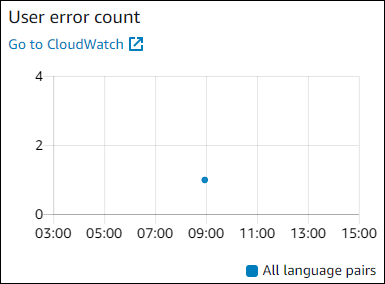
User error count The number of user errors that occurred during the specified time period. User errors are in the HTTP error code range 400-499. |
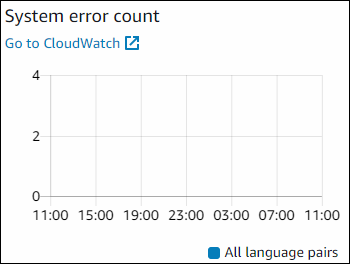
|
System error count The number of system errors that occurred during the specified time period. System errors are in the HTTP error code range 500-599. |
Monitoring Amazon Translate
With Amazon CloudWatch, you can get metrics for individual Amazon Translate operations or global Amazon Translate metrics for your account. Use metrics to track the health of your Amazon Translate solutions and to set up alarms to notify you when one or more metrics fall outside a defined threshold. For example, you can monitor the number of requests made to Amazon Translate in a particular time period, see the latency of requests, or raise an alarm when errors exceed a threshold.
Understanding CloudWatch metrics for Amazon Translate
To get metrics for your Amazon Translate operations, you specify the following information:
-
The metric dimension. A dimension is a set of name-value pairs that you use to identify a metric. Amazon Translate has two dimensions:
-
Operation -
Language pair
-
-
The metric name, such as
SuccessfulRequestCountorRequestCharacters. For a complete list of metrics, see CloudWatch Metrics for Amazon Translate.
You can get metrics for Amazon Translate with the AWS Management Console, the AWS CLI, or the CloudWatch API. You can use the CloudWatch API through one of the Amazon AWS Software Development Kits (SDKs) or the CloudWatch API tools.
The following table lists some common uses for CloudWatch metrics. These are suggestions to get you started, not a comprehensive list.
| How do I? | Monitor this metric |
|---|---|
| Track the number of successful requests | The sum statistic of the SuccessfulRequestCount metric |
| Know if my application has reached its maximum throughput | The sum statistic of the ThrottledCount metric |
| Find the response time for my application | The average statistic of the ResponseTime metric |
| Find the number of errors for my application | The sum statistic of the ServerErrorCount and
UserErrorCount metrics |
| Find the number of billable characters | The sum statistic of the CharacterCount metric |
You must have the appropriate CloudWatch permissions to monitor Amazon Translate with CloudWatch For more information, see Authentication and Access Control for Amazon CloudWatch in the Amazon CloudWatch User Guide.
Viewing Amazon Translate metrics
View Amazon Translate metrics in the CloudWatch console.
To view metrics (CloudWatch console)
Sign in to the AWS Management Console and open the CloudWatch console at https://console.aws.amazon.com/cloudwatch/
. -
Choose Metrics, choose All Metrics, and then choose AWS/Translate.
-
Choose the dimension, choose a metric name, and choose Add to graph.
-
Choose a value for the date range. The metric count for the specified date range is displayed in the graph.