This whitepaper is for historical reference only. Some content might be outdated and some links might not be available.
Designing data warehousing workflows
In the previous sections, we discussed the features of Amazon Redshift that make it ideally suited for data warehousing. To understand how to design data warehousing workflows with Amazon Redshift, let’s look at the most common design pattern, along with an example use case.
Suppose that a multinational clothing maker has more than a thousand retail stores, sells certain clothing lines through department and discount stores, and has an online presence. From a technical standpoint, these three channels currently operate independently. They have different management, point-of-sale systems, and accounting departments. No single system merges all the related datasets together to provide the CEO with a 360-degree view across the entire business.
Suppose the CEO wants to get a company-wide picture of these channels, and perform analytics such as the following:
-
What trends exist across channels?
-
Which geographic regions do better across channels?
-
How effective are the company’s advertisements and promotions?
-
What trends exist across each clothing line?
-
Which external forces have impacts on the company’s sales; for example, the unemployment rate and weather conditions?
-
What online ads are most effective?
-
How do store attributes affect sales; for example, tenure of employees and management, strip mall versus enclosed mall, location of merchandise in the store, promotion, endcaps, sales circulars, and in-store displays?
An enterprise data warehouse solves this problem. It collects data from each of the three channels’ various systems, and from publicly available data such as weather and economic reports. Each data source sends data daily for consumption by the data warehouse. Clickstream data are streamed continuously and stored on S3. Because each data source might be structured differently, an ETL process is performed to reformat the data into a common structure. Then analytics can be performed across data from all sources simultaneously. To do this, we use the following data flow architecture:
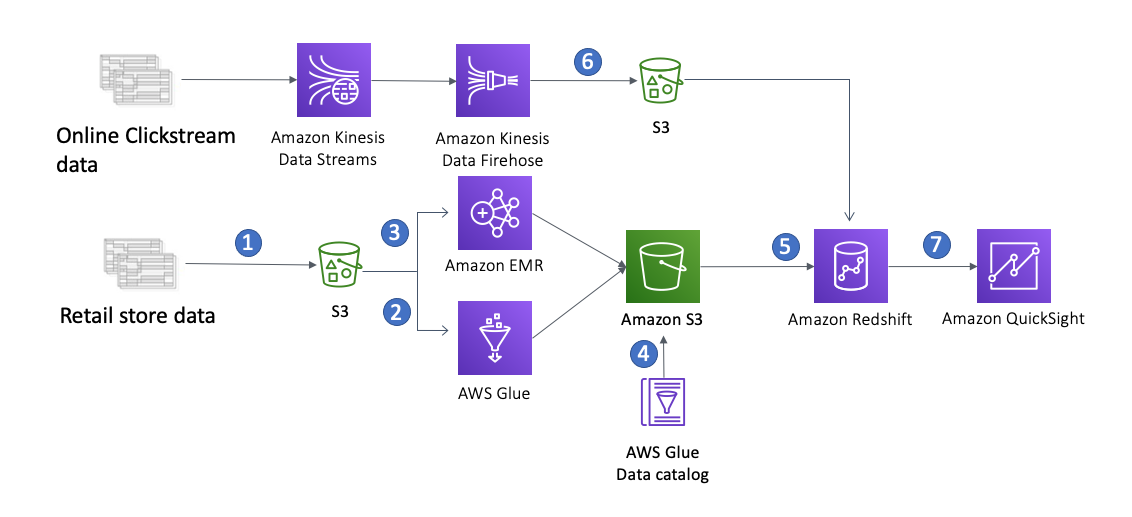
Enterprise data warehouse workflow
-
The first step is getting the data from different sources into S3. S3 provides a highly durable, inexpensive, and scalable storage platform that can be written to in parallel from many different sources at a low cost.
-
For batch ETL, you can use either Amazon EMR or AWS Glue. AWS Glue is a fully managed ETL service that simplifies ETL job creation and eliminates the need to provision and manage infrastructure. You pay only for the resources used while your jobs are running. AWS Glue also provides a centralized metadata repository. Simply point AWS Glue to your data stored in AWS, and AWS Glue discovers your data and stores the associated table definition and schema in the AWSAWS Glue Data Catalog. Once cataloged, your data is immediately searchable, can be queried, and is available for ETL.
-
Amazon EMR can transform and cleanse the data from the source format to go into the destination format. Amazon EMR has built-in integration with S3, which allows parallel threads of throughput from each node in your Amazon EMR cluster to and from S3. Typically, a data warehouse gets new data on a nightly basis. Because there is usually no need for analytics in the middle of the night, the only requirement around this transformation process is that it finishes by the morning when the CEO and other business users need to access reports and dashboards.
You can use the Amazon EC2 Spot market
to further bring down the cost of ETL. A good spot strategy is to start bidding at a low price at midnight, and continually increase your price over time until capacity is granted. As you get closer to the deadline, if spot bids have not succeeded, you can fall back to on-demand prices to ensure you still meet your completion time requirements. Each source might have a different transformation process on Amazon EMR, but with the AWS pay-as-you-go model, you can create a separate Amazon EMR cluster for each transformation. You can tune each cluster it to be exactly the right capacity to complete all data transformation jobs without contending with resources for the other jobs. -
Each transformation job loads formatted, cleaned data into S3. We use S3 here again because Amazon Redshift can load the data in parallel from S3, using multiple threads from each cluster node. S3 also provides an historical record, and serves as the formatted source of truth between systems. Data on S3 is cataloged by AWS Glue. The metadata is stored in the AWS Glue data catalog, which allows it to be consumed by other tools for analytics or machine learning if additional requirements are introduced over time.
-
Amazon Redshift loads, sorts, distributes, and compresses the data into its tables so that analytical queries can execute efficiently and in parallel. If you leverage an RA3 instance with Amazon Redshift managed storage, Amazon Redshift can automatically scale storage as your data increases. As the business expands, you can enable Amazon Redshift concurrency scaling to handle more and more user requests, and keep near-linear performance. With new workloads are added, you can increase data warehouse capacity in minutes by adding more nodes via Amazon Redshift elastic resize
. -
Clickstream data is stored on S3 via Firehose hourly, or even more frequently. Because Amazon Redshift can query S3 external data via Spectrum without having to load them into a data warehouse, you can track the customer online journey in near real-time, and join it with sales data in your data warehouse to understand customer behavior better. This provides a more complete picture of customers, and enables business users to get insight sooner, and take action.
-
To visualize the analytics, you can use Amazon QuickSight
or one of the many partner visualization platforms that connect to Amazon Redshift using ODBC or JDBC. This point is where the CEO and their staff view reports, dashboards, and charts. Now executives can use the data for making better decisions about company resources, which ultimately increases earnings and value for shareholders.
You can easily expand this flexible architecture when your business expands, opens new channels, launches additional customer-specific mobile applications, and brings in more data sources. It takes just a few clicks in the Amazon Redshift Management Console, or a few API calls.
