This whitepaper is for historical reference only. Some content might be outdated and some links might not be available.
AWS X-Ray
One of the challenges of modern applications is they are built from a number of distributed components and services, making it difficult to determine the cause of issues and isolate the underlying responsible service or component. For example, a ASP.NET application may be running on a number of load-balanced EC2 instances, with each instance depending on a SQL Server database hosted on Amazon RDS, and additional functionality being provided by a number of microservices hosted across EC2 instances, containers, and Lambda functions. Although CloudWatch provides rich capabilities to monitor each individual component, trying to isolate which distributed components is causing a problem is a challenge in its own right.
AWS X-Ray
For each request into your application, data is recorded as a series of segments that are grouped into a trace. Once a trace is recorded, you can view it from the trace history, allowing you to inspect your application’s performance and behavior to help focus on potential problems.
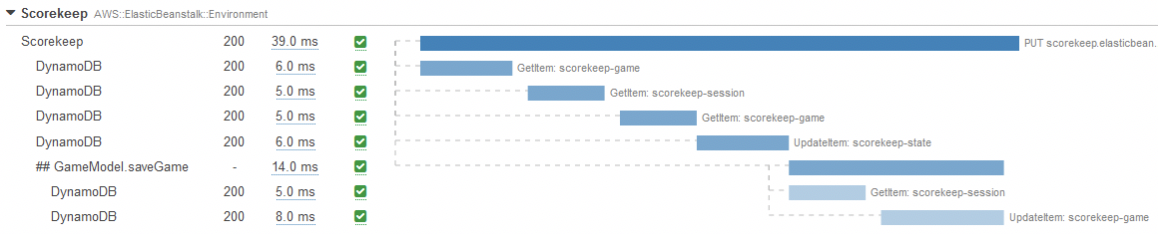
AWS X-Ray trace example
AWS X-Ray can also display service graphs, which show graphical views of the services used by your application, helping to isolate various issues, including faults, latency spikes, and possible bottlenecks.

AWS X-Ray service graph example showing integration across various components
By providing a cohesive view of end-to-end application behavior, AWS X-Ray makes it possible to accurately and quickly identify sources of problems in distributed systems. At a glance, it helps locate an API, microservice, or component with problems, allowing you to drill down farther with more detailed tools, such as Amazon CloudWatch.
