Debugging CloudWatch synthetics canaries using X-Ray
CloudWatch Synthetics is a fully managed service that enables you to monitor your endpoints and APIs using scripted canaries that run 24 hours per day, once per minute.
You can customize canary scripts to check for changes in:
-
Availability
-
Latency
-
Transactions
-
Broken or dead links
-
Step-by-step task completions
-
Page load errors
-
Load Latencies for UI assets
-
Complex wizard flows
-
Checkout flows in your application
Canaries follow the same routes and perform the same actions and behaviors as your customers, and continually verify the customer experience.
To learn more about setting up Synthetics tests, see Using Synthetics to Create and Manage Canaries.
The following examples show common use cases for debugging issues that your Synthetics canaries raise. Each example demonstrates a key strategy for debugging using either the trace map or the X-Ray Analytics console.
For more information about how to read and interact with the trace map, see Viewing the Service Map.
For more information about how to read and interact with the X-Ray Analytics console, see Interacting with the AWS X-Ray Analytics Console.
Topics
View canaries with increased error reporting in the trace map
Use trace details maps for individual traces to view each request in detail
Determine the root cause of ongoing failures in upstream and downstream services
Compare latency and error or fault rates before and after changes
Determine the required canary coverage for all APIs and URLs
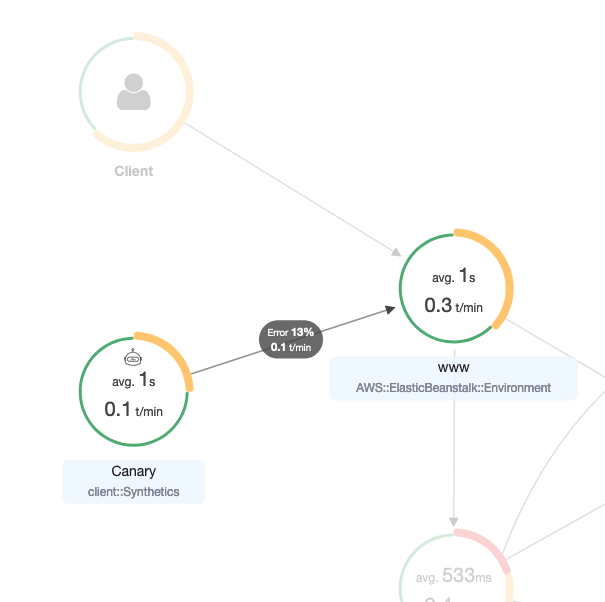
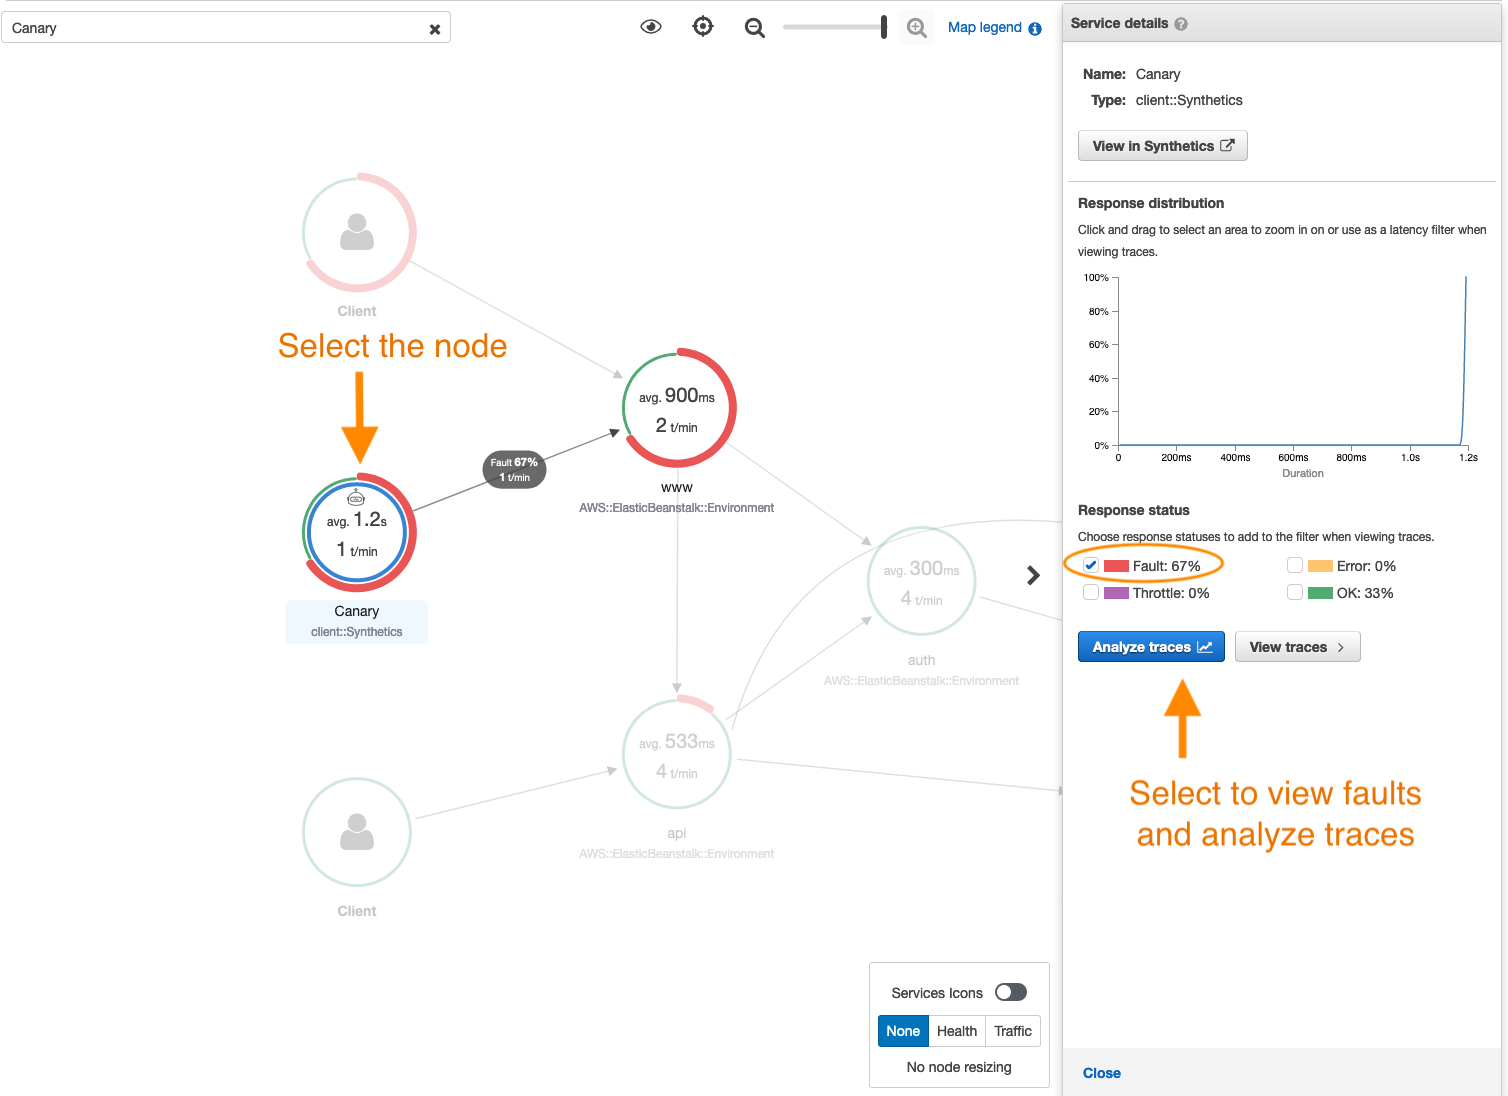
View canaries with increased error reporting in the trace map
To see which canaries have an increase in errors, faults, throttling rates, or slow response times within
your X-Ray trace map, you can highlight
Synthetics
canary client nodes using the Client::Synthetic
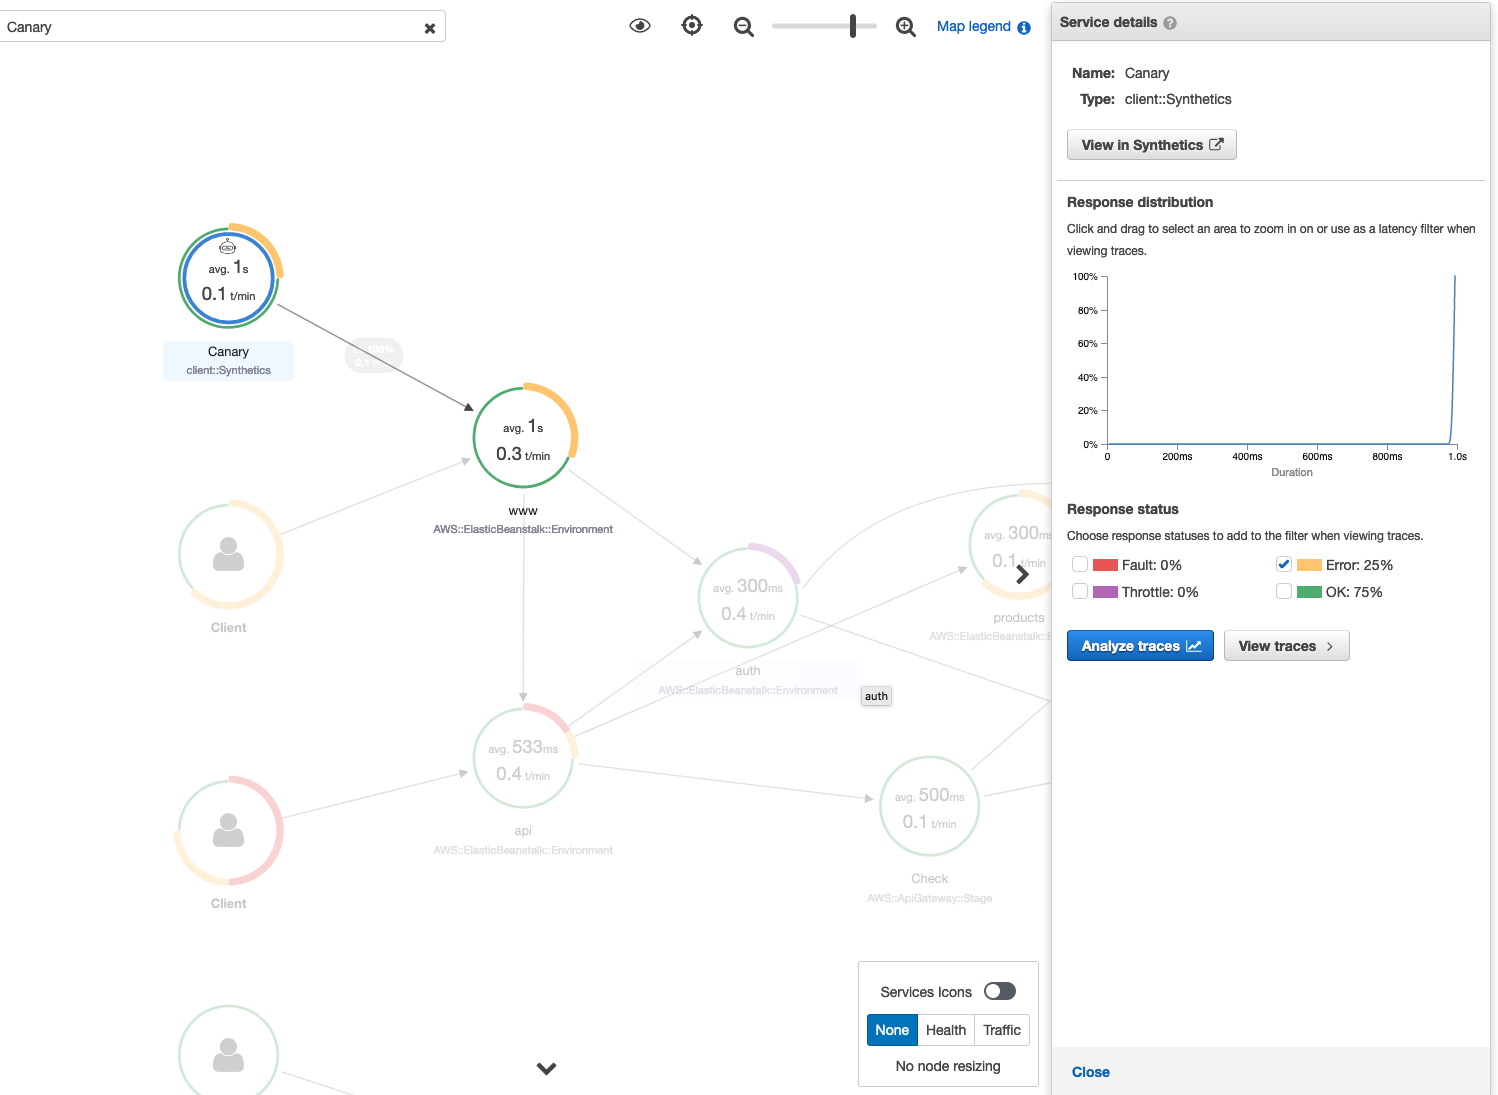
filter. Clicking a node displays the response
time distribution of the entire request. Clicking an edge between two nodes shows details about the requests that traveled that connection.
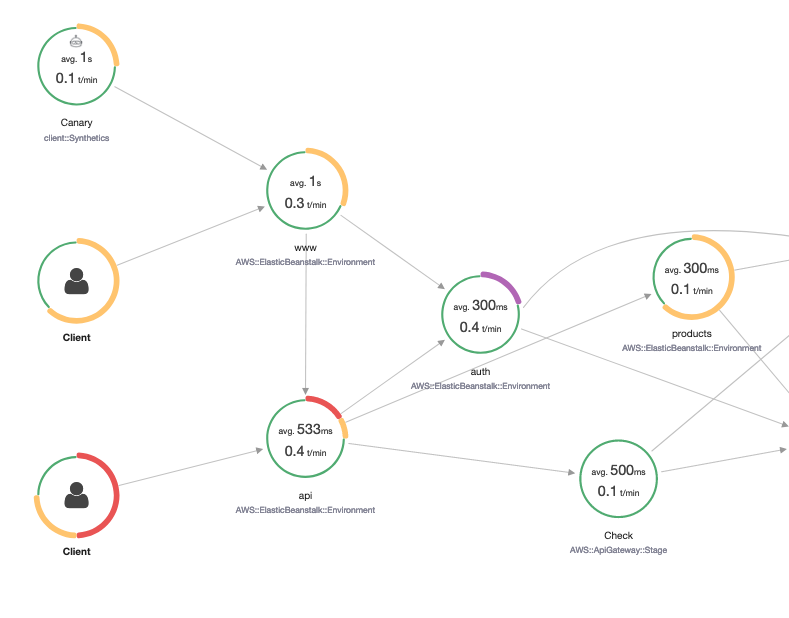
You can also view "remote" inferred nodes for related downstream services in your trace map.
When you click the Synthetics node, there is a View in Synthetics button on side panel which redirects you to the Synthetics console where you can check the canary details.
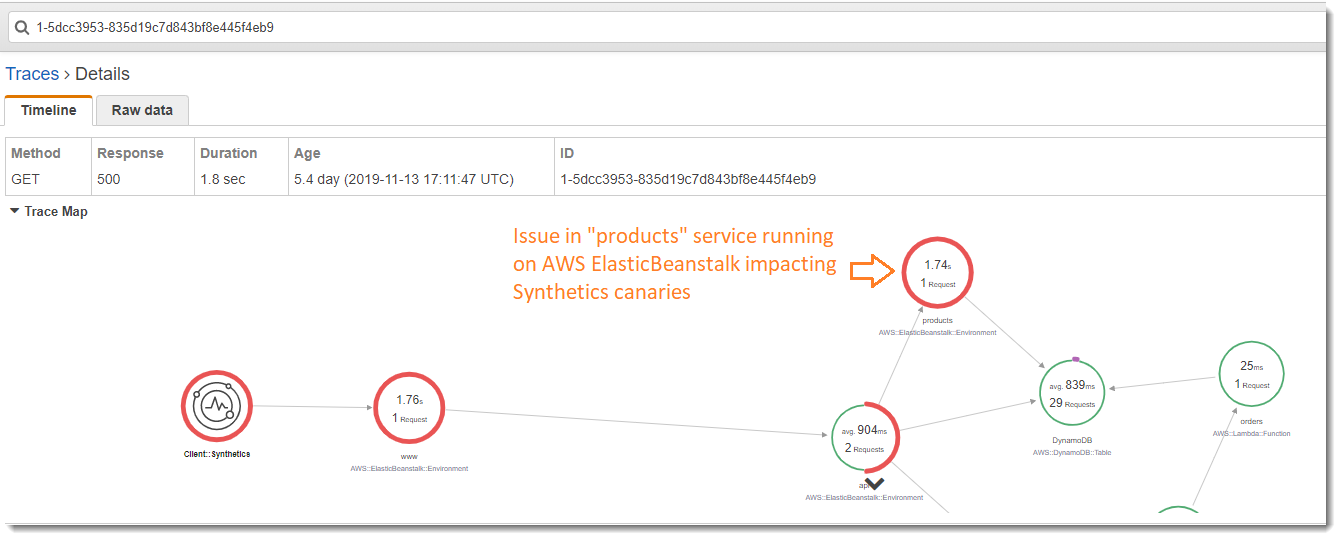
Use trace details maps for individual traces to view each request in detail
To determine which service results in the most latency or is causing an error, invoke the trace details map by selecting the trace in the trace map. Individual trace details maps display the end-to-end path of a single request. Use this to understand the services invoked, and visualize the upstream and downstream services.
Determine the root cause of ongoing failures in upstream and downstream services
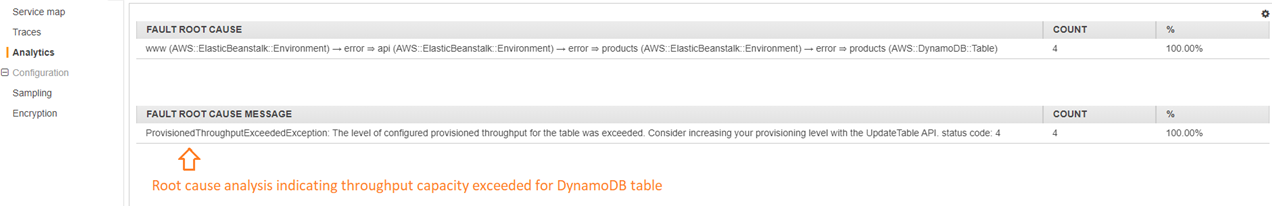
Once you receive a CloudWatch alarm for failures in a Synthetics canary, use the statistical modeling on trace data in X-Ray to determine the probable root cause of the issue within the X-Ray Analytics console. In the Analytics console, the Response Time Root Cause table shows recorded entity paths. X-Ray determines which path in your trace is the most likely cause for the response time. The format indicates a hierarchy of entities that are encountered, ending in a response time root cause.
The following example shows that the Synthetics test for API “XXX” running on API Gateway is failing due to a throughput capacity exception from the Amazon DynamoDB table.
Identify performance bottlenecks and trends
You can view trends in the performance of your endpoint over time using continuous traffic from your Synthetics canaries to populate a trace details map over a period of time.
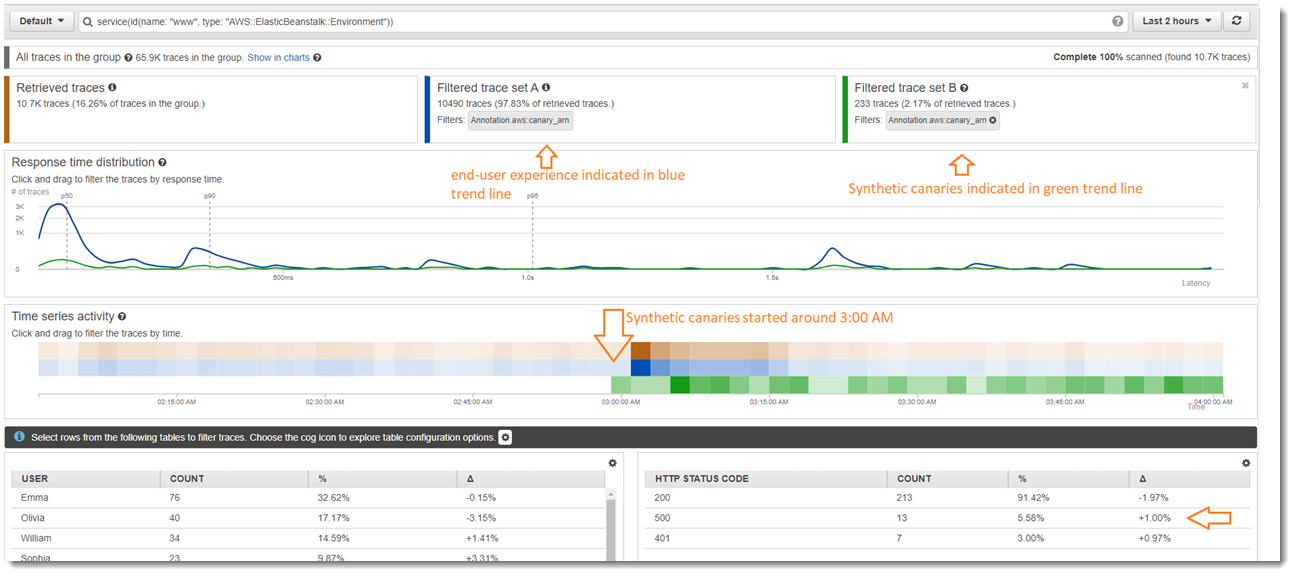
Compare latency and error or fault rates before and after changes
Pinpoint the time a change occurred to correlate that change to an increase in issues caught by your canaries. Use the X-Ray Analytics console to define the before and after time ranges as different trace sets, creating a visual differentiation in the response time distribution.
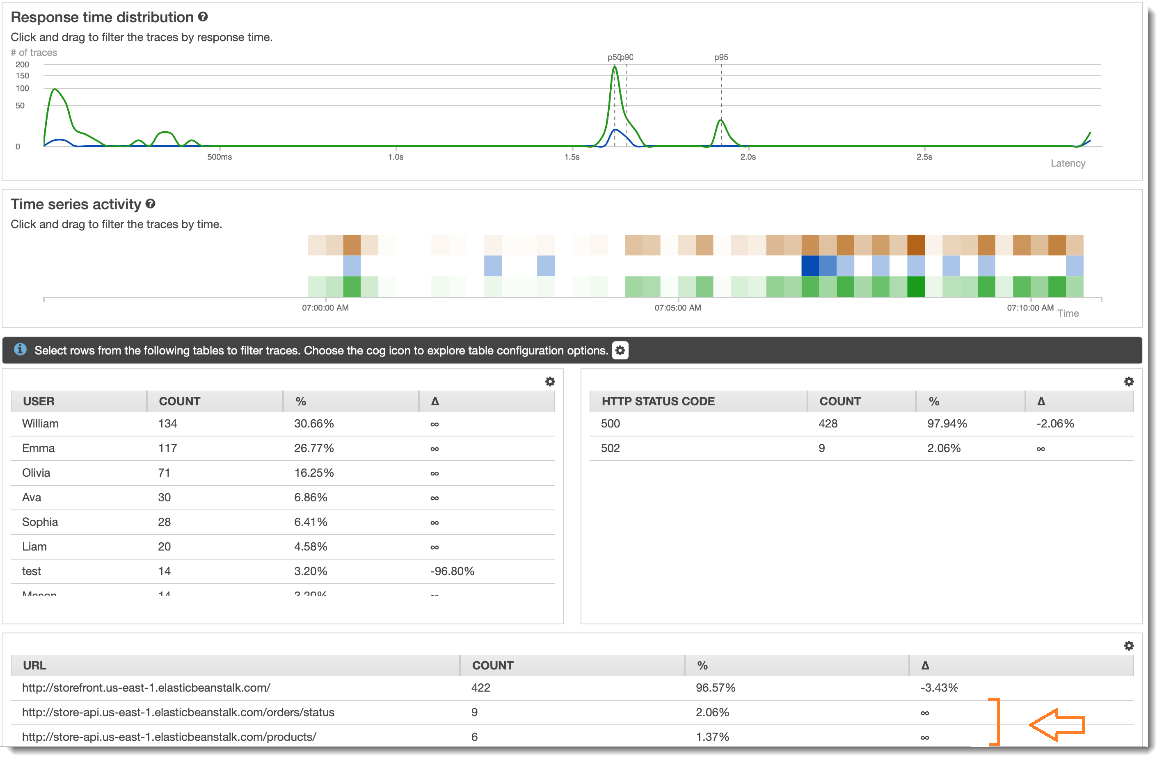
Determine the required canary coverage for all APIs and URLs
Use X-Ray Analytics to compare the experience of canaries with the users. The UI below shows a blue trend line for canaries and a green line for the users. You can also identify that two out of the three URLs don’t have canary tests.
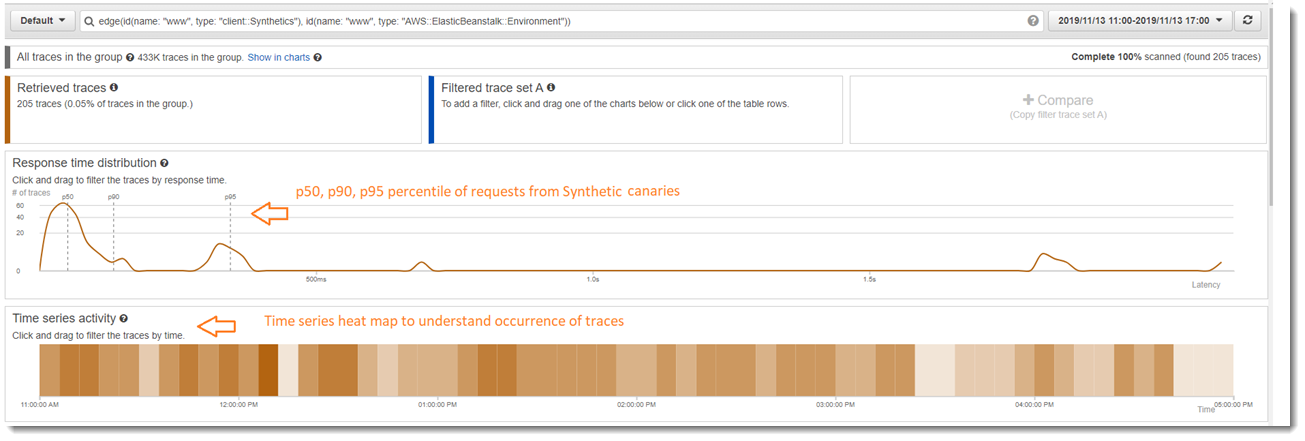
Use groups to focus on synthetics tests
You can create an X-Ray group using a filter expression to focus on a certain set of workflows, such as a Synthetics tests for application “www” running on
AWS Elastic Beanstalk. Use the complex keywords
service() and edge() to filter through services and edges.
Example Group filter expression
"edge(id(name: "www", type: "client::Synthetics"), id(name: "www", type: "AWS::ElasticBeanstalk::Environment"))"