Adding Cost Allocation Tags - Cloud Intelligence Dashboards on AWS

Adding Cost Allocation Tags

DEPRECATED

This content is DEPRECATED. Please use Organizational Taxonomy Guide.

Last Updated

October 2024

Introduction

Now that you have your CID dashboards deployed, you may want to view or group some of the visuals by tags you’re using. Common use cases include seeing spend by application, identifying opportunity by cost category, or building charge-back mechanisms to business units.

If you have cost allocation tags or cost categories setup in your AWS account, you will see those tags in your CUR. They show up as their own column. You can confirm that these tags are present by going to Athena and expanding your CUR table. If you scroll down, you should find your tags and cost categories.

Prerequisites

For this solution you must have the following:

Step by Step Guide

This guide assumes you have enabled one or more user or AWS tags and waited up to 24 hours for the tags to become available in the CUR data, and for Amazon QuickSight to refresh datasets.

Step 1. Modify Queries in Athena

You will need to modify several queries in Athena to add the tags. Queries that you can modify to enable tags are:

  • summary_view

  • hourly_view

  • resource_view

Follow instructions depending on the CUR version you use:

Legacy CUR
  1. Navigate in the AWS Console to the Athena service

  2. Select the AwsDataCatalog in the DataSource drop down

  3. In the Database drop down select the database where your CUR table is located.

  4. We’ll first confirm that we see the tags in the CUR table.

  5. In the tables list, locate your CUR table and click the plus sign next to the table to expand all the fields for that table.

  6. Above the table list type in resource_tags_ and the list of either AWS or user tags that were enabled in Cost Explorer are displayed.

  7. After confirming that the tags you would like to add are available, clear your search and we’ll modify the first view.

  8. Under Views, scroll down until you locate the summary_view.

  9. Select the three dots to the right of the view and select Show/edit query from the context menu.

    Athena Query editor highlighting the summary view query and its context menu to select show edit query
  1. On the line after, , "line_item_usage_account_id" "linked_account_id" in the query add a blank line below that.

    CREATE OR REPLACE VIEW "summary_view" AS SELECT "year" , "month" , "bill_billing_period_start_date" "billing_period" , (CASE WHEN ("date_trunc"('month', "line_item_usage_start_date") >= ("date_trunc"('month', current_timestamp) - INTERVAL '3' MONTH)) THEN "date_trunc"('day', "line_item_usage_start_date") ELSE "date_trunc"('month', "line_item_usage_start_date") END) "usage_date" , "bill_payer_account_id" "payer_account_id" , "line_item_usage_account_id" "linked_account_id" , "bill_invoice_id" "invoice_id" , "line_item_line_item_type" "charge_type"... ::
  2. From the table list, expand your cur table and filter on resource_tags_.

  3. Double-click on the first tag that you want to add. Remove the trailing comma that is added and place a comma at the beginning of that line. It will look like this:

    CREATE OR REPLACE VIEW "summary_view" AS SELECT "year" , "month" , "bill_billing_period_start_date" "billing_period" , (CASE WHEN ("date_trunc"('month', "line_item_usage_start_date") >= ("date_trunc"('month', current_timestamp) - INTERVAL '3' MONTH)) THEN "date_trunc"('day', "line_item_usage_start_date") ELSE "date_trunc"('month', "line_item_usage_start_date") END) "usage_date" , "bill_payer_account_id" "payer_account_id" , "line_item_usage_account_id" "linked_account_id" , "resource_tags_user_cost_center" "cost_center_tag" , "bill_invoice_id" "invoice_id" , "line_item_line_item_type" "charge_type"...
  4. Add a friendly name to the field. In our example we’ll add cost_center_tag

  5. Scroll down and add the next highest number in the GROUP BY clause.

    GROUP BY 1, 2, 3, 4, 5, 6, 7, 8, 9, 10, 11, 12, 13, 14, 15, 16, 17, 18, 19, 20, 21, 22, 23, 24, 25, 26, 27, 28, 29, 30, 31, 32, 33, 34, 35, 36, 37
  6. For each additional tag that you want, create a blank line below the preceding one and repeat the same steps.

  7. When you’ve completed adding all of the fields, click the RUN button and confirm that the query view updates successfully.

    Inset show the run again button of the query window and the successful result
  8. Repeat the steps above on the hourly_view and resource_view datasets.

CUR 2.0
  1. Navigate in the AWS Console to the Athena service

  2. Select the AwsDataCatalog in the DataSource drop down

  3. In the Database drop down select the database where your CUR table is located (data_export).

  4. We’ll first confirm that we see the tags in the CUR table. Run this query to list all available Tag keys.

    SELECT DISTINCT key FROM cur2 CROSS JOIN UNNEST(map_keys(resource_tags)) AS t(key)
  5. After confirming that the tags you would like to add are available, we can start with the first view.

  6. Under Views, scroll down until you locate the summary_view.

  7. Select the three dots to the right of the view and select Show/edit query from the context menu.

  8. On the line after , "line_item_usage_account_id" "linked_account_id" in the query add a blank line below that.

    CREATE OR REPLACE VIEW "summary_view" AS SELECT split_part("billing_period", '-', 1) "year" , split_part("billing_period", '-', 2) "month" , "bill_billing_period_start_date" "billing_period" , (CASE WHEN ("date_trunc"('month', "line_item_usage_start_date") >= ("date_trunc"('month', current_timestamp) - INTERVAL '3' MONTH)) THEN "date_trunc"('day', "line_item_usage_start_date") ELSE "date_trunc"('month', "line_item_usage_start_date") END) "usage_date" , "bill_payer_account_id" "payer_account_id" , "line_item_usage_account_id" "linked_account_id" , resource_tags['user_cost_center'] as cost_center_tag -- <- NEW LINE ADDED , "bill_invoice_id" "invoice_id" , "line_item_line_item_type" "charge_type"...
  9. Add a friendly name to the field. In our example we’ll add cost_center_tag

  10. Scroll down and add the next highest number in the GROUP BY clause.

    GROUP BY 1, 2, 3, 4, 5, 6, 7, 8, 9, 10, 11, 12, 13, 14, 15, 16, 17, 18, 19, 20, 21, 22, 23, 24, 25, 26, 27, 28, 29, 30, 31, 32, 33, 34, 35, 36, 37
  11. For each additional tag that you want, create a blank line below the preceding one and repeat the same steps.

  12. When you’ve completed adding all of the fields, click the RUN button and confirm that the query view updates successfully.

    Inset show the run again button of the query window and the successful result
  13. Repeat the steps above on the hourly_view and resource_view datasets.

Step 2. Modify Data Set in Amazon QuickSight

Next the data set in Amazon QuickSight needs to be updated so that you can see the added fields to use them in your Dashboards and Analyses.

  1. Navigate to Amazon QuickSight in the console.

    AWS Console search with results for QuickSight
  2. Select Datasets on the left side of the page.

    Left navigation in QuickSight with datasets option highlighted
  3. Locate summary_view in the list of datasets and click on the dataset.

  4. Click on the EDIT DATASET button in the top right of the page.

    QuickSight edit dataset button
  5. Allow the fields and dataset preview windows to load.

  6. Confirm that you can see the fields you’ve added in the list. This can be accomplished by entering the friendly name of the field in the search fields input.

    Close up of QuickSight edit dataset field search and list
  7. Once you have confirmed you see all your fields, click the Save & Publish button in the top right of the dataset editor page.

    QuickSight save & publish button
  8. A refresh of the dataset will be triggered. Monitor the status to confirm that it completed successfully.

    Summary view dataset summary tab showing dataset refresh status
  9. Repeat the steps above on the hourly_view and resource_view datasets.

Note

Troubleshooting not seeing the tags If you do not see your custom fields, go back to Athena and confirm that the query view has run and updated successfully. Also make sure you are searching for the friendly name you gave the field in the Athena view.

Step 3. Modify QuickSight Analysis - CUDOS Dashboard

After the dataset has been updated you can now add those fields to different visualizations. Here we will demonstrate how you can update the CUDOS dashboard to use the tags you have added.

Note

Publishing over existing dashboard When you make changes, if you republish to the same dashboard and deploy a new version of the dashboard your changes will be overwritten.

Note

Deploying updates with --force If you deploy an update to the CUDOS/CID dashboards with the --force option it will overwrite your Athena query view changes and published dashboard changes

  1. First we’ll need to save the dashboard as an analysis so we can make changes.

  2. Open the CUDOS dashboard and select the save icon, selecting "save as" in the drop down selection to save the dashboard as an analysis.

    QuickSight save as analysis dialog
  3. Open the analysis.

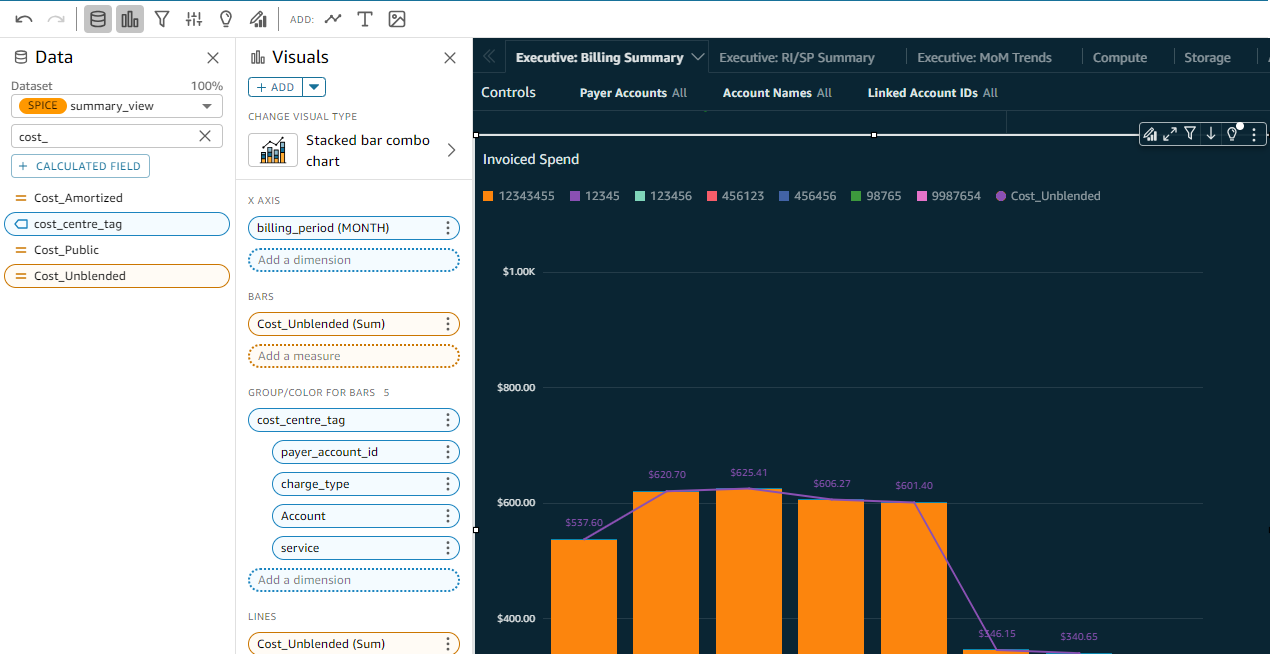
  4. Select the tab Executive: Billing Summary and click into a visual you wish to group by tag.

  5. In the Data column on the left, search for the friendly name (cost_center_tag in this example) for one of the tags you added.

    QuickSight field list with search for cost center
  6. Drag and Drop that field into the Group/Color for Bars area of the Visuals column. You can add it as a drill down layer, or replace the original field.

    QuickSight edit visualization showing custom field added to visual field well
  7. Repeat this customization for any additional visuals you wish to change.

Step 4. (Optional) Modify TAGsplorer sheet

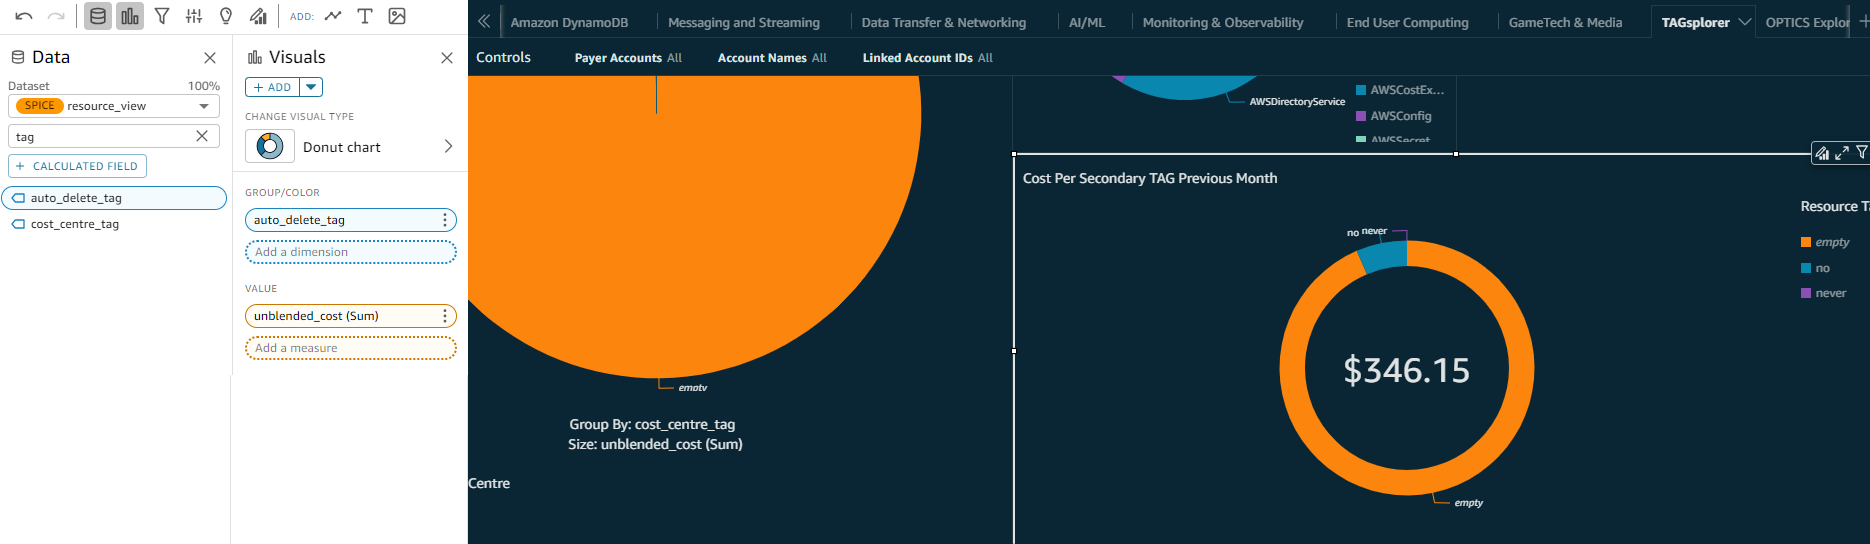
The CUDOS dashboard has a sheet titled TAGsplorer which has visuals that are intended to sort data by a "primary" and "secondary" tag. These tags can be any two of the tags you would like to see in these visualizations. You must have updated your resource_view dataset to include tags using the above steps.

  1. Select the Cost Per Primary TAG Previous Month visual.

  2. In the Data column on the left, search for the friendly name of the tag you want to add as primary.

  3. Drag and Drop that field into the Group/Color area of the Visuals column.

    QuickSight tagsplorer primary tag added to visualization
  4. Select the Cost Per Secondary TAG Previous Month visual.

  5. In the Data column on the left, search for the tag you want to add as secondary.

  6. Drag and Drop that field into the Group/Color area of the Visuals column.

    QuickSight tagsplorer secondary tag added to visualization
  7. Save and publish your analysis.

Summary

We’ve shown you how you can customize your datasets, views and dashboards to have AWS and user tags that are enabled in Cost Explorer in your visualizations.