Instrumenting Ruby code in AWS Lambda
Lambda integrates with AWS X-Ray to enable you to trace, debug, and optimize Lambda applications. You can use X-Ray to trace a request as it traverses resources in your application, from the frontend API to storage and database on the backend. By simply adding the X-Ray SDK library to your build configuration, you can record errors and latency for any call that your function makes to an AWS service.
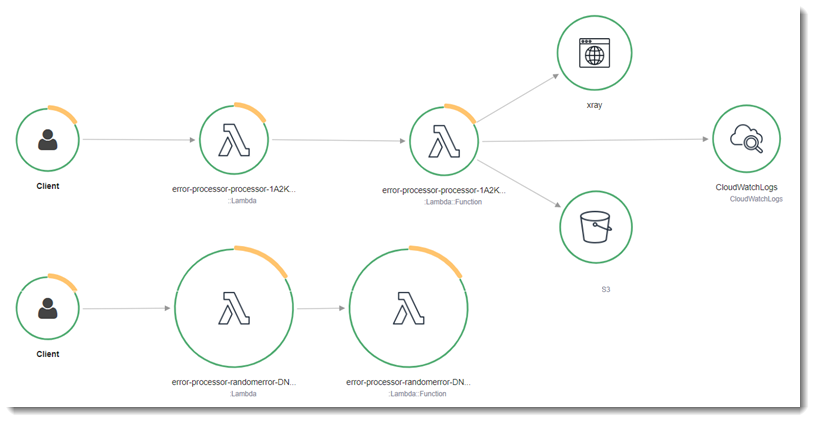
After you've configured active tracing, you can observe specific requests through your application. The X-Ray service graph shows information about your application and all its components. The following example from the error processor sample application shows an application with two functions. The primary function processes events and sometimes returns errors. The second function at the top processes errors that appear in the first's log group and uses the AWS SDK to call X-Ray, Amazon Simple Storage Service (Amazon S3), and Amazon CloudWatch Logs.
To toggle active tracing on your Lambda function with the console, follow these steps:
To turn on active tracing
Open the Functions page
of the Lambda console. -
Choose a function.
Choose Configuration and then choose Monitoring and operations tools.
Choose Edit.
-
Under X-Ray, toggle on Active tracing.
-
Choose Save.
Pricing
You can use X-Ray tracing for free each month up to a certain limit as part of the AWS Free Tier. Beyond that threshold, X-Ray charges for trace storage and
retrieval. For more information, see AWS X-Ray pricing
Your function needs permission to upload trace data to X-Ray. When you activate tracing in the Lambda
console, Lambda adds the required permissions to your function's execution role. Otherwise, add the AWSXRayDaemonWriteAccess
X-Ray doesn't trace all requests to your application. X-Ray applies a sampling algorithm to ensure that tracing is efficient, while still providing a representative sample of all requests. The sampling rate is 1 request per second and 5 percent of additional requests.
Note
You cannot configure the X-Ray sampling rate for your functions.
In X-Ray, a trace records information about a request that is processed by one or more services. Lambda records 2 segments per trace, which creates two nodes on the service graph. The following image highlights these two nodes for the primary function from the error processor sample application.
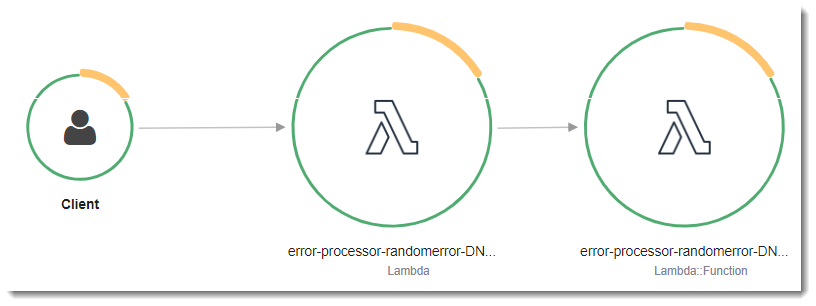
The first node on the left represents the Lambda service, which receives the invocation request. The second
node represents your specific Lambda function. The following example shows a trace with these two segments. Both
are named my-function, but one has an origin of AWS::Lambda and the other has
an origin of AWS::Lambda::Function. If the AWS::Lambda segment shows an error, the Lambda service had an issue. If the AWS::Lambda::Function segment shows an error, your function had an issue.
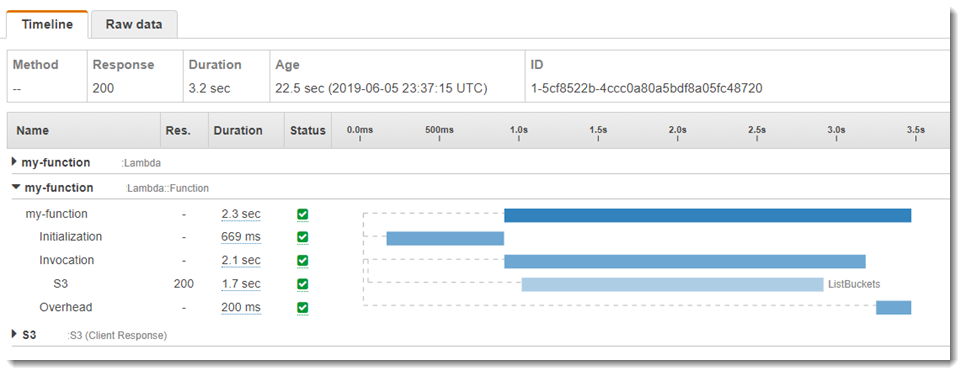
This example expands the AWS::Lambda::Function segment to show its three subsegments:
-
Initialization – Represents time spent loading your function and running initialization code. This subsegment only appears for the first event that each instance of your function processes.
-
Invocation – Represents the time spent running your handler code.
-
Overhead – Represents the time the Lambda runtime spends preparing to handle the next event.
You can instrument your handler code to record metadata and trace downstream calls. To record detail about calls
that your handler makes to other resources and services, use the X-Ray SDK for Ruby. To get the SDK, add the
aws-xray-sdk package to your application's dependencies.
Example blank-ruby/function/Gemfile
# Gemfile source 'https://rubygems.org'gem 'aws-xray-sdk', '0.11.4'gem 'aws-sdk-lambda', '1.39.0' gem 'test-unit', '3.3.5'
To instrument AWS SDK clients, require the aws-xray-sdk/lambda module after creating a client in
initialization code.
Example blank-ruby/function/lambda_function.rb
# lambda_function.rb require 'logger' require 'json' require 'aws-sdk-lambda' $client = Aws::Lambda::Client.new() $client.get_account_settings()require 'aws-xray-sdk/lambda'def lambda_handler(event:, context:) logger = Logger.new($stdout) ...
In X-Ray, a trace records information about a request that is processed by one or more services. Lambda records 2 segments per trace, which creates two nodes on the service graph. The following image highlights these two nodes for the primary function from the error processor sample application.
The first node on the left represents the Lambda service, which receives the invocation request. The second
node represents your specific Lambda function. The following example shows a trace with these two segments. Both
are named my-function, but one has an origin of AWS::Lambda and the other has
an origin of AWS::Lambda::Function. If the AWS::Lambda segment shows an error, the Lambda service had an issue. If the AWS::Lambda::Function segment shows an error, your function had an issue.
This example expands the AWS::Lambda::Function segment to show its three subsegments:
-
Initialization – Represents time spent loading your function and running initialization code. This subsegment only appears for the first event that each instance of your function processes.
-
Invocation – Represents the time spent running your handler code.
-
Overhead – Represents the time the Lambda runtime spends preparing to handle the next event.
You can also instrument HTTP clients, record SQL queries, and create custom subsegments with annotations and metadata. For more information, see The X-Ray SDK for Ruby in the AWS X-Ray Developer Guide.
Sections
Enabling active tracing with the Lambda API
To manage tracing configuration with the AWS CLI or AWS SDK, use the following API operations:
The following example AWS CLI command enables active tracing on a function named my-function.
aws lambda update-function-configuration --function-name my-function \
--tracing-config Mode=Active
Tracing mode is part of the version-specific configuration when you publish a version of your function. You can't change the tracing mode on a published version.
Enabling active tracing with AWS CloudFormation
To activate tracing on an AWS::Lambda::Function resource in an AWS CloudFormation template, use the
TracingConfig property.
Example function-inline.yml
Resources: function: Type: AWS::Lambda::Function Properties:TracingConfig: Mode: Active...
For an AWS Serverless Application Model (AWS SAM) AWS::Serverless::Function resource, use the Tracing
property.
Example template.yml
Resources: function: Type: AWS::Serverless::Function Properties:Tracing: Active...
Storing runtime dependencies in a layer
If you use the X-Ray SDK to instrument AWS SDK clients your function code, your deployment package can become quite large. To avoid uploading runtime dependencies every time you update your function code, package the X-Ray SDK in a Lambda layer.
The following example shows an AWS::Serverless::LayerVersion resource that stores X-Ray SDK for
Ruby.
Example template.yml
Resources: function: Type: AWS::Serverless::Function Properties: CodeUri: function/. Tracing: ActiveLayers: - !Ref libs...libs: Type: AWS::Serverless::LayerVersion Properties: LayerName: blank-ruby-lib Description: Dependencies for the blank-ruby sample app. ContentUri: lib/. CompatibleRuntimes: - ruby2.5
With this configuration, you update the library layer only if you change your runtime dependencies. Since the function deployment package contains only your code, this can help reduce upload times.
Creating a layer for dependencies requires build changes to generate the layer archive prior to deployment.
For a working example, see the blank-ruby
