Managing Aurora PostgreSQL connection churn with pooling
When client applications connect and disconnect so often that Aurora PostgreSQL DB cluster response time slows, the cluster is said to be experiencing connection churn. Each new connection to the Aurora PostgreSQL DB cluster endpoint consumes resources, thus reducing the resources that can be used to process the actual workload. Connection churn is an issue that we recommend that you manage by following some of the best practices discussed following.
For starters, you can improve response times on Aurora PostgreSQL DB clusters that have high rates of connection churn. To do this, you can use a connection pooler, such as RDS Proxy. A connection pooler provides a cache of ready to use connections for clients. Almost all versions of Aurora PostgreSQL support RDS Proxy. For more information, see Amazon RDS Proxy with Aurora PostgreSQL.
If your specific version of Aurora PostgreSQL doesn't support RDS Proxy, you
can use another PostgreSQL–compatible connection pooler, such as PgBouncer. To learn more, see the
PgBouncer
To see if your Aurora PostgreSQL DB cluster can benefit from connection pooling, you can check the postgresql.log file
for connections and disconnections. You can also use Performance Insights to find out how much connection churn
your Aurora PostgreSQL DB cluster is experiencing. Following, you can
find information about both topics.
Logging connections and disconnections
The PostgreSQL log_connections and log_disconnections parameters
can capture connections and disconnections to the writer instance
of the Aurora PostgreSQL DB cluster. By default, these parameters are turned off. To turn these parameters on,
use a custom parameter group and turn on by changing the value to 1. For more information
about custom parameter groups, see DB cluster parameter groups for Amazon Aurora DB clusters. To check the settings, connect to
your DB cluster endpoint for Aurora PostgreSQL by using psql and query as follows.
labdb=>SELECT setting FROM pg_settings WHERE name = 'log_connections';setting --------- on (1 row)labdb=>SELECT setting FROM pg_settings WHERE name = 'log_disconnections';setting --------- on (1 row)
With both of these parameters turned on, the log captures all new connections and disconnections. You see the user and database for each new authorized connection. At disconnection time, the session duration is also logged, as shown in the following example.
2022-03-07 21:44:53.978 UTC [16641] LOG: connection authorized: user=labtek database=labdb application_name=psql
2022-03-07 21:44:55.718 UTC [16641] LOG: disconnection: session time: 0:00:01.740 user=labtek database=labdb host=[local]
To check your application for connection churn, turn on these parameters if they're not on already. Then gather data in the PostgreSQL log for analysis by running your application with a realistic workload and time period. You can view the log file in the RDS console. Choose the writer instance of your Aurora PostgreSQL DB cluster, and then choose the Logs & events tab. For more information, see Viewing and listing database log files.
Or you can download the log file from the console and use the following command sequence. This sequence finds the total number of connections authorized and dropped per minute.
grep "connection authorized\|disconnection: session time:" postgresql.log.2022-03-21-16|\
awk {'print $1,$2}' |\
sort |\
uniq -c |\
sort -n -k1
In the example output, you can see a spike in authorized connections followed by disconnections starting at 16:12:10.
.....
,......
.........
5 2022-03-21 16:11:55 connection authorized:
9 2022-03-21 16:11:55 disconnection: session
5 2022-03-21 16:11:56 connection authorized:
5 2022-03-21 16:11:57 connection authorized:
5 2022-03-21 16:11:57 disconnection: session
32 2022-03-21 16:12:10 connection authorized:
30 2022-03-21 16:12:10 disconnection: session
31 2022-03-21 16:12:11 connection authorized:
27 2022-03-21 16:12:11 disconnection: session
27 2022-03-21 16:12:12 connection authorized:
27 2022-03-21 16:12:12 disconnection: session
41 2022-03-21 16:12:13 connection authorized:
47 2022-03-21 16:12:13 disconnection: session
46 2022-03-21 16:12:14 connection authorized:
41 2022-03-21 16:12:14 disconnection: session
24 2022-03-21 16:12:15 connection authorized:
29 2022-03-21 16:12:15 disconnection: session
28 2022-03-21 16:12:16 connection authorized:
24 2022-03-21 16:12:16 disconnection: session
40 2022-03-21 16:12:17 connection authorized:
42 2022-03-21 16:12:17 disconnection: session
40 2022-03-21 16:12:18 connection authorized:
40 2022-03-21 16:12:18 disconnection: session
.....
,......
.........
1 2022-03-21 16:14:10 connection authorized:
1 2022-03-21 16:14:10 disconnection: session
1 2022-03-21 16:15:00 connection authorized:
1 2022-03-21 16:16:00 connection authorized:
With this information, you can decide if your workload can benefit from a connection pooler. For more detailed analysis, you can use Performance Insights.
Detecting connection churn with Performance Insights
You can use Performance Insights to assess the amount of connection churn on your Aurora PostgreSQL-Compatible Edition DB cluster. When you create an Aurora PostgreSQL DB cluster, the setting for Performance Insights is turned on by default. If you cleared this choice when you created your DB cluster, modify your cluster to turn on the feature. For more information, see Modifying an Amazon Aurora DB cluster.
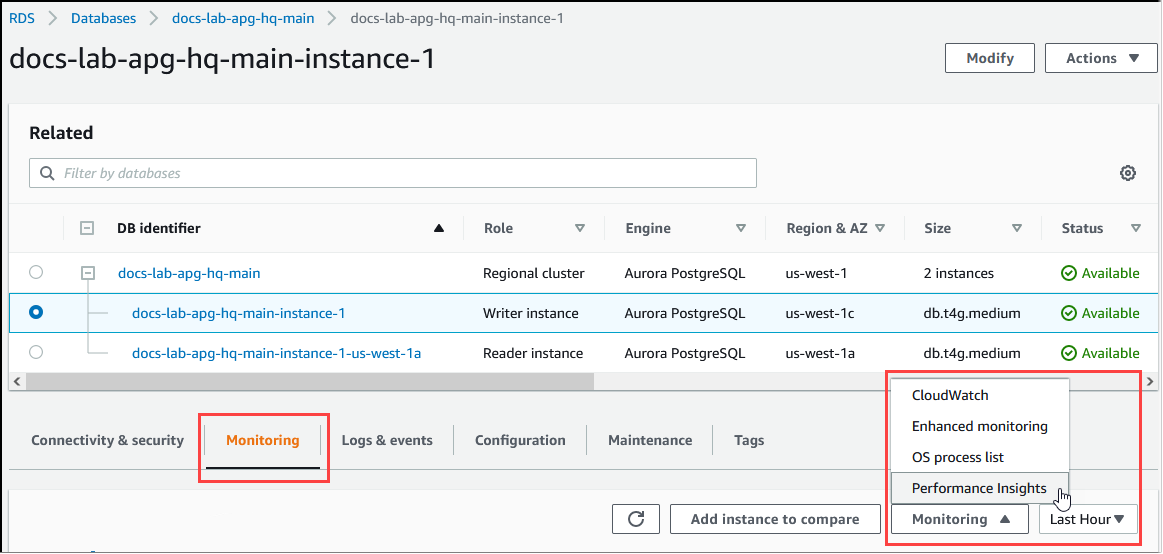
With Performance Insights running on your Aurora PostgreSQL DB cluster, you can choose the metrics that you want to monitor. You can access Performance Insights from the navigation pane in the console. You can also access Performance Insights from the Monitoring tab of the writer instance for your Aurora PostgreSQL DB cluster, as shown in the following image.
From the Performance Insights console, choose Manage metrics. To analyze your Aurora PostgreSQL DB cluster's connection and disconnection activity, choose the following metrics. These are all metrics from PostgreSQL.
xact_commit– The number of committed transactions.total_auth_attempts– The number of attempted authenticated user connections per minute.numbackends– The number of backends currently connected to the database.
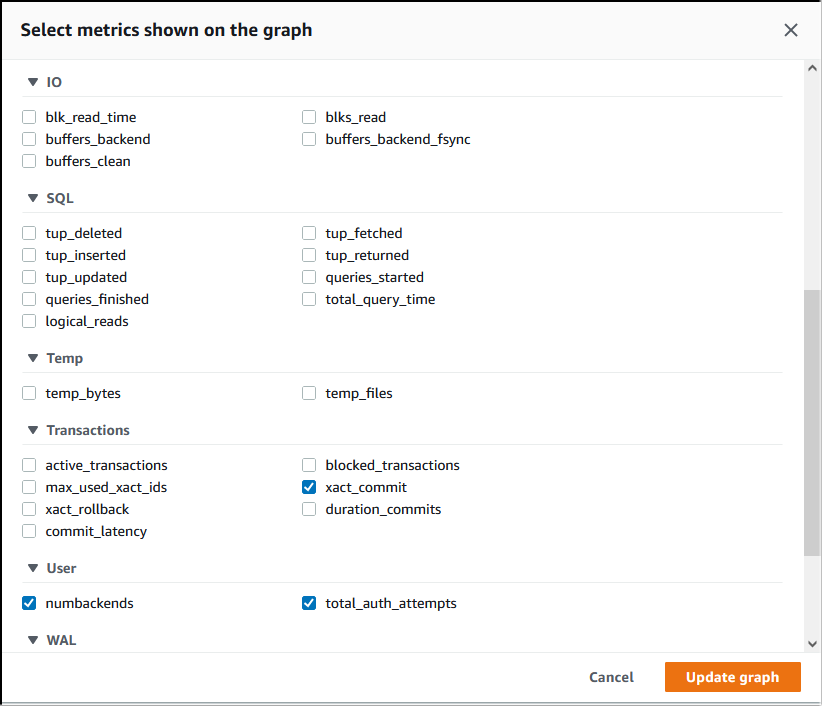
To save the settings and display connection activity, choose Update graph.
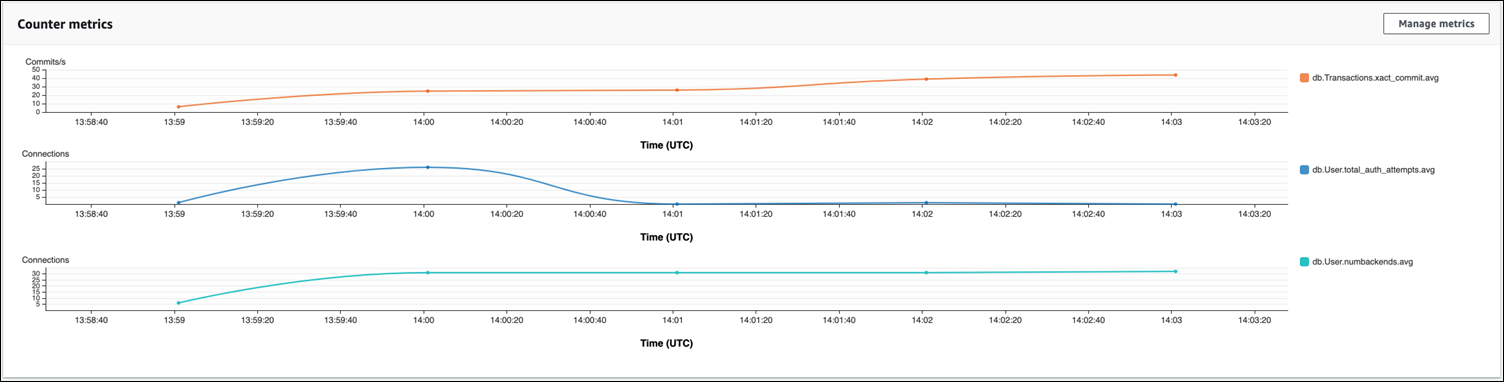
In the following image, you can see the impact of running pgbench with
100 users. The line showing connections is on a consistent upward slope. To learn more about
pgbench and how to use it, see pgbench

The image shows that running a workload with as few as 100 users
without a connection pooler can cause a significant increase in the number of
total_auth_attempts throughout the duration of workload processing.
Note that it's best to keep total_auth_attempts as close to zero as possible.
With RDS Proxy connection pooling, the connection attempts increase at the start of the workload. After setting up the connection pool, the average declines. The resources used by transactions and backend use stays consistent throughout workload processing.
For more information about using Performance Insights with your Aurora PostgreSQL DB cluster, see Monitoring DB load with Performance Insights on Amazon Aurora. To analyze the metrics, see Analyzing metrics with the Performance Insights dashboard.
Demonstrating the benefits of connection pooling
As mentioned previously, if you determine that your Aurora PostgreSQL DB cluster has a connection churn problem, you can use RDS Proxy for improved performance. Following, you can find an example that shows the differences in processing a workload when connections are pooled and when they're not. The example uses pgbench to model a transaction workload.
As is psql, pgbench is a PostgreSQL client application that you can install and run from
your local client machine. You can also install and run it from the Amazon EC2 instance that you
use for managing your Aurora PostgreSQL DB cluster. For more information, see pgbench
To step through this example, you first create the pgbench environment in your database. The
following command is the basic template for initializing the pgbench tables in the specified
database. This example uses the default main user account, postgres, for the
login. Change it as needed for your Aurora PostgreSQL DB cluster. You create the pgbench
environment in a database on the writer instance of your cluster.
Note
The pgbench initialization process drops and recreates tables named
pgbench_accounts, pgbench_branches,
pgbench_history, and pgbench_tellers. Be sure that the database
that you choose for dbname
pgbench -U postgres -hdb-cluster-instance-1.111122223333.aws-region.rds.amazonaws.com -p 5432 -d -i -s 50dbname
For pgbench, specify the following parameters.
- -d
-
Outputs a debugging report as pgbench runs.
- -h
-
Specifies the endpoint of the Aurora PostgreSQL DB cluster's writer instance.
- -i
-
Initializes the pgbench environment in the database for the benchmark tests.
- -p
-
Identifies the port used for database connections. The default for Aurora PostgreSQL is typically 5432 or 5433.
- -s
-
Specifies the scaling factor to use for populating the tables with rows. The default scaling factor is 1, which generates 1 row in the
pgbench_branchestable, 10 rows in thepgbench_tellerstable, and 100000 rows in thepgbench_accountstable. - -U
-
Specifies the user account for the Aurora PostgreSQL DB cluster's writer instance.
After the pgbench environment is set up, you can then run benchmarking tests with and without connection pooling. The default test consists of a series of five SELECT, UPDATE, and INSERT commands per transaction that run repeatedly for the time specified. You can specify scaling factor, number of clients, and other details to model your own use cases.
As an example, the command that follows runs the benchmark for 60 seconds (-T option, for time) with 20 concurrent connections (the -c option). The -C option makes the test run using a new connection each time, rather than once per client session. This setting gives you an indication of the connection overhead.
pgbench -h docs-lab-apg-133-test-instance-1.c3zr2auzukpa.us-west-1.rds.amazonaws.com -U postgres -p 5432 -T 60 -c 20 -C labdbPassword:**********pgbench (14.3, server 13.3) starting vacuum...end. transaction type: <builtin: TPC-B (sort of)> scaling factor: 50 query mode: simple number of clients: 20 number of threads: 1 duration: 60 s number of transactions actually processed: 495 latency average = 2430.798 ms average connection time = 120.330 ms tps = 8.227750 (including reconnection times)
Running pgbench on the writer instance of an Aurora PostgreSQL DB cluster without reusing connections shows that only about 8 transactions are processed each second. This gives a total of 495 transactions during the 1-minute test.
If you reuse connections, the response from Aurora PostgreSQL DB cluster for the number of users is almost 20 times faster. With reuse, a total of 9,042 transactions is processed compared to 495 in the same amount of time and for the same number of user connections. The difference is that in the following, each connection is being reused.
pgbench -h docs-lab-apg-133-test-instance-1.c3zr2auzukpa.us-west-1.rds.amazonaws.com -U postgres -p 5432 -T 60 -c 20 labdbPassword:*********pgbench (14.3, server 13.3) starting vacuum...end. transaction type: <builtin: TPC-B (sort of)> scaling factor: 50 query mode: simple number of clients: 20 number of threads: 1 duration: 60 s number of transactions actually processed: 9042 latency average = 127.880 ms initial connection time = 2311.188 ms tps = 156.396765 (without initial connection time)
This example shows you that pooling connections can significantly improve response times. For information about setting up RDS Proxy for your Aurora PostgreSQL DB cluster, see Amazon RDS Proxy for Aurora.
