Viewing OS metrics using CloudWatch Logs
After you have enabled Enhanced Monitoring for your DB instance or Multi-AZ DB cluster, you can view the metrics for it
using CloudWatch Logs, with each log stream representing a single DB instance or DB cluster being monitored. The log stream identifier is the
resource identifier (DbiResourceId) for the DB instance or DB cluster.
To view Enhanced Monitoring log data
-
Open the CloudWatch console at https://console.aws.amazon.com/cloudwatch/
. -
If necessary, choose the AWS Region that your DB instance or Multi-AZ DB cluster is in. For more information, see Regions and endpoints in the Amazon Web Services General Reference.
-
Choose Logs in the navigation pane.
-
Choose RDSOSMetrics from the list of log groups.
In a Multi-AZ DB instance deployment, log files with
-secondaryappended to the name are for the Multi-AZ standby replica.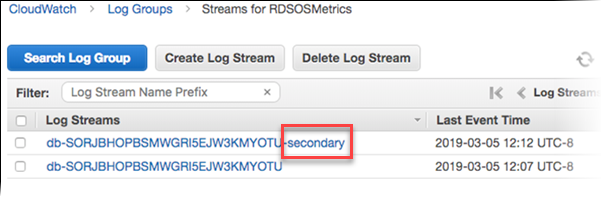
-
Choose the log stream that you want to view from the list of log streams.
