Accessing the Performance Insights dashboard
Amazon RDS provides a consolidated view of Performance Insights and CloudWatch metrics in the Performance Insights dashboard.
To access the Performance Insights dashboard, use the following procedure.
To view the Performance Insights dashboard in the AWS Management Console
Open the Amazon RDS console at https://console.aws.amazon.com/rds/
. -
In the left navigation pane, choose Performance Insights.
-
Choose a DB instance.
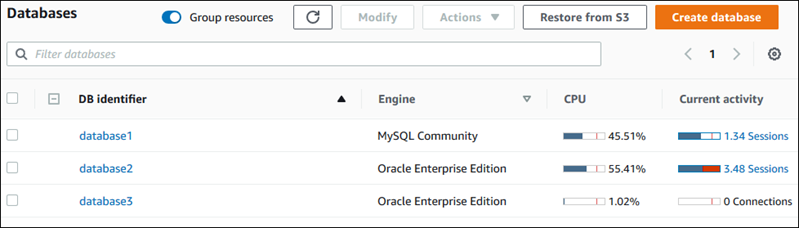
For DB instances with Performance Insights turned on, you can also access the Performance Insights dashboard by choosing the Sessions item in the list of DB instances. Under Current activity, the Sessions item shows the database load in average active sessions over the last five minutes. The bar graphically shows the load. When the bar is empty, the DB instance is idle. As the load increases, the bar fills with blue. When the load passes the number of virtual CPUs (vCPUs) on the DB instance class, the bar turns red, indicating a potential bottleneck.
-
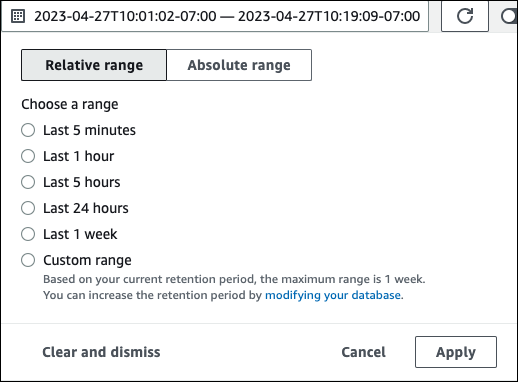
(Optional) Choose the date or time range in the upper right and specify a different relative or absolute time interval. You can now specify a time period, and generate a database performance analysis report. The report provides the identified insights and recommendations. For more information, see Creating a performance analysis report in Performance Insights.
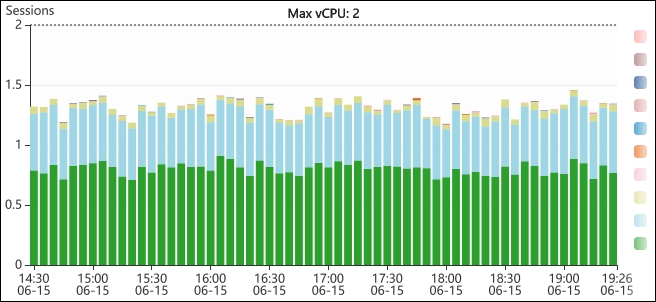
In the following screenshot, the DB load interval is 5 hours.
-
(Optional) To zoom in on a portion of the DB load chart, choose the start time and drag to the end of the time period you want.
The selected area is highlighted in the DB load chart.
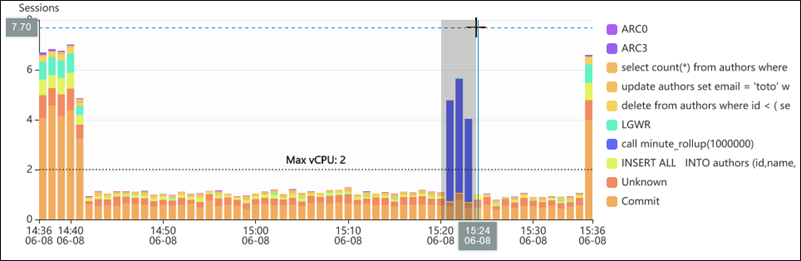
When you release the mouse, the DB load chart zooms in on the selected AWS Region, and the Top dimensions table is recalculated.
-
(Optional) To refresh your data automatically, select Auto refresh.

The Performance Insights dashboard automatically refreshes with new data. The refresh rate depends on the amount of data displayed:
-
5 minutes refreshes every 10 seconds.
-
1 hour refreshes every 5 minutes.
-
5 hours refreshes every 5 minutes.
-
24 hours refreshes every 30 minutes.
-
1 week refreshes every day.
-
1 month refreshes every day.
-
