In the new monitoring view, you can create a custom dashboard with the metrics you need to meet your analysis requirements.
You can create a custom dashboard by selecting Performance Insights and CloudWatch metrics for your DB instance. You can use this custom dashboard for other DB instances of the same database engine type in your AWS account.
Note
The customized dashboard supports up to 50 metrics.
Use the widget settings menu to edit or delete the dashboard, and move or resize the widget window.
To create a custom dashboard with Performance Insights in the navigation pane
Sign in to the AWS Management Console and open the Amazon RDS console at https://console.aws.amazon.com/rds/
. -
In the left navigation pane, choose Performance Insights.
-
Choose a DB instance.
-
Scroll down to the Metrics tab in the window.
-
Select the custom dashboard from the drop down list. The following example shows the custom dashboard creation.

-
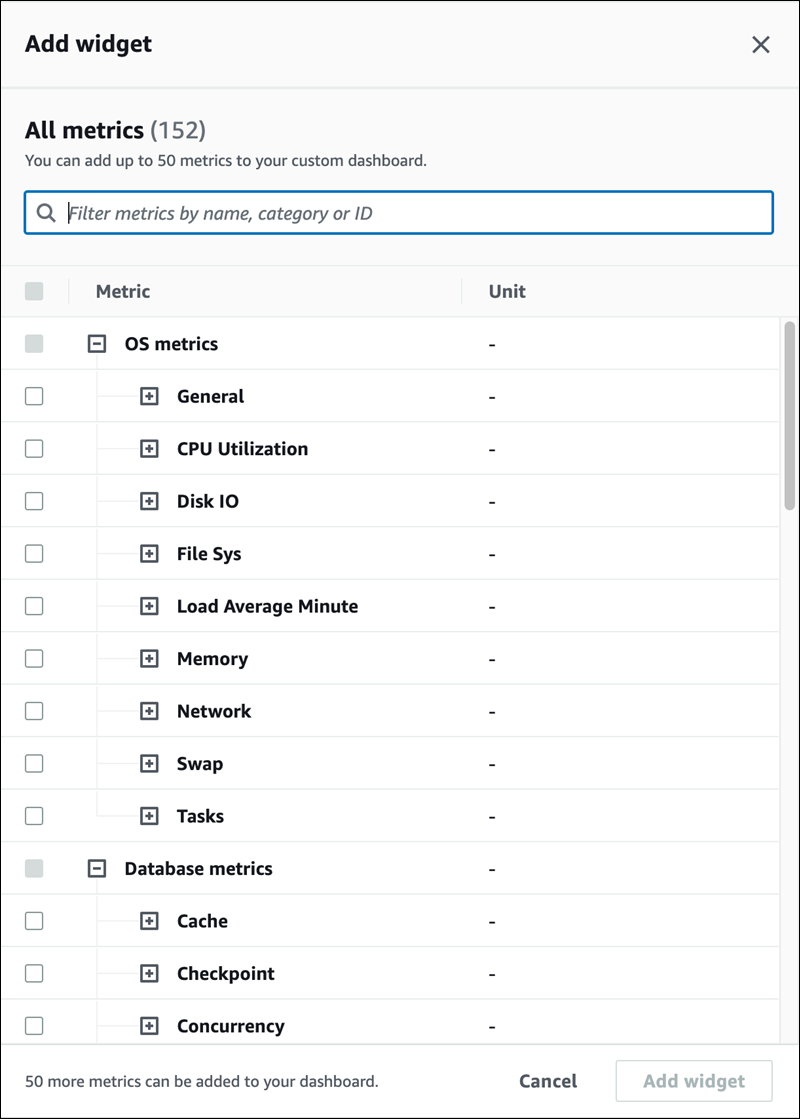
Choose Add widget to open the Add widget window. You can open and view the available operating system (OS) metrics, database metrics, and CloudWatch metrics in the window.
The following example shows the Add widget window with the metrics.

-
Select the metrics that you want to view in the dashboard and choose Add widget. You can use the search field to find a specific metric.
The selected metrics appear on your dashboard.
-
(Optional) If you want to modify or delete your dashboard, choose the settings icon on the upper right of the widget, and then select one of the following actions in the menu.
Edit – Modify the metrics list in the window. Choose Update widget after you select the metrics for your dashboard.
-
Delete – Deletes the widget. Choose Delete in the confirmation window.