CloudWatch contributor insights for DynamoDB: How it works
Amazon DynamoDB integrates with CloudWatch Contributor Insights to provide information about the most accessed and throttled items in a table or global secondary index. DynamoDB delivers this information to you via CloudWatch Contributor Insights rules, reports, and graphs of report data.
CloudWatch Contributor Insights for DynamoDB is designed to have no performance impact on your DynamoDB table.
For more information about CloudWatch Contributor Insights, see Using Contributor Insights to analyze high-cardinality data in the Amazon CloudWatch User Guide.
The following sections describe the core concepts and behavior of CloudWatch Contributor Insights for DynamoDB.
Topics
CloudWatch contributor insights modes for DynamoDB
CloudWatch Contributor Insights for DynamoDB offers two distinct modes to meet different monitoring needs.
Throttled keys mode
This mode focuses exclusively on throttled requests by only processing events when throttling occurs. It delivers insights about performance issues without the overhead of tracking all access patterns. In this mode, DynamoDB tracks only the:
-
Most throttled items — Items that experience the most throttling events
This mode is ideal when:
-
Your primary concern is identifying and resolving throttling problems
-
You want to keep Contributor Insights enabled continuously for real-time throttling detection
-
You want a cost-optimized approach to monitor throttling issues
Note
Throttled keys mode processes events only when throttling occurs, making it cost-effective for continuous monitoring. This targeted approach allows you to leave the feature enabled permanently with minimal cost impact, while still providing immediate visibility into throttling issues as they happen.
If your table experiences no throttling, you won't see any data in the Contributor Insights graphs, which indicates healthy performance. When throttling is detected, the generated graphs help you identify specific access patterns causing performance issues. This information can help you implement strategies to address non-uniform access patterns.
For comprehensive monitoring strategies, you can integrate these throttling insights with other CloudWatch metrics to create unified dashboards that correlate throttling events with overall table performance.
Accessed and throttled keys mode
This mode provides comprehensive monitoring of both accessed and throttled items. In this mode, DynamoDB tracks the:
-
Most accessed items — Items that consume the most read and write capacity
-
Most throttled items — Items that experience the most throttling events
This mode is ideal when you need complete visibility into your table's access patterns and want to understand both high-traffic items and throttling issues.
Switching between modes
You can switch between modes at any time using the DynamoDB console, AWS CLI, or APIs. When you switch modes:
-
Existing CloudWatch rules are updated to match the new mode
-
Throttled key CloudWatch rules remain intact, maintaining your continuous historical data for throttling metrics:
-
When you switch from throttled keys mode to accessed and throttled keys mode, the existing throttled key rules are preserved, and new accessed key rules are created
-
When you switch from accessed and throttled keys mode to throttled keys mode, only the throttled key rules are preserved, and the accessed key rules are removed
-
-
Billing adjusts immediately to reflect the new mode's event processing
CloudWatch contributor insights for DynamoDB rules
When you enable CloudWatch Contributor Insights for DynamoDB on a table or global secondary index, DynamoDB creates rules on your behalf based on the selected mode.
Note
When you enable Contributor Insights on your DynamoDB table, you're subject to Contributor Insights rules limits. For more information, see CloudWatch service quotas.
Rules for accessed and throttled keys mode
In accessed and throttled keys mode, DynamoDB creates the following rules:
-
Most accessed items (partition key) — Identifies the partition keys of the most accessed items in your table or global secondary index.
CloudWatch rule name format:
DynamoDBContributorInsights-PKC-[resource_name]-[creationtimestamp] -
Most throttled keys (partition key) — Identifies the partition keys of the most throttled items in your table or global secondary index.
CloudWatch rule name format:
DynamoDBContributorInsights-PKT-[resource_name]-[creationtimestamp]
If your table or global secondary index has a sort key, DynamoDB also creates the following rules specific to sort keys:
-
Most accessed keys (partition and sort keys) — Identifies the partition and sort keys of the most accessed items in your table or global secondary index.
CloudWatch rule name format:
DynamoDBContributorInsights-SKC-[resource_name]-[creationtimestamp] -
Most throttled keys (partition and sort keys) — Identifies the partition and sort keys of the most throttled items in your table or global secondary index.
CloudWatch rule name format:
DynamoDBContributorInsights-SKT-[resource_name]-[creationtimestamp]
Rules for throttled keys mode
In throttled keys mode, DynamoDB creates only the throttling-related rules:
-
Most throttled keys (partition key) — Identifies the partition keys of the most throttled items in your table or global secondary index.
CloudWatch rule name format:
DynamoDBContributorInsights-PKT-[resource_name]-[creationtimestamp]
If your table or global secondary index has a sort key, DynamoDB also creates:
-
Most throttled keys (partition and sort keys) — Identifies the partition and sort keys of the most throttled items in your table or global secondary index.
CloudWatch rule name format:
DynamoDBContributorInsights-SKT-[resource_name]-[creationtimestamp]
This focused approach reduces the number of active rules and decreases the volume of events processed to better diagnose your throttling events.
Note
-
When you use the CloudWatch console or APIs to view CloudWatch Contributor Insights for DynamoDB, you only see rules corresponding to your selected mode.
-
You can't use the CloudWatch console or APIs to directly modify or delete the rules created by CloudWatch Contributor Insights for DynamoDB. Disabling CloudWatch Contributor Insights for DynamoDB on a table or global secondary index automatically deletes the rules created for that table or global secondary index.
-
When you use the GetInsightRuleReport operation with CloudWatch Contributor Insights rules that are created by DynamoDB, only
MaxContributorValueandMaximumreturn useful statistics. The other statistics in this list don't return meaningful values. -
CloudWatch Contributor Insights for DynamoDB has a limit of 25 contributors. Requesting more than 25 contributors will return an error.
You can create CloudWatch Alarms using the CloudWatch Contributor Insights for DynamoDB rules. This allows you to be notified when any item exceed or meets a
specific threshold for ConsumedThroughputUnits or
ThrottleCount. For more information, see Setting an alarm on Contributor Insights metric
data.
Understanding CloudWatch contributor insights for DynamoDB graphs
CloudWatch Contributor Insights for DynamoDB displays different types of graphs on both the DynamoDB and CloudWatch consoles depending on the selected mode.
Graph availability by mode
The graphs displayed depend on your selected Contributor Insights mode.
-
Accessed and throttled keys mode displays both Most Accessed Items and Most Throttled Items graphs
-
Throttled keys mode displays only Most Throttled Items graphs
Most accessed items
This graph is available only in accessed and throttled keys mode. Use this graph
to identify the most accessed items in the table or global secondary index. The
graph displays ConsumedThroughputUnits on the y-axis and time on the
x-axis. Each of the top N keys is displayed in its own color, with a legend
displayed below the x-axis.
DynamoDB measures key access frequency by using ConsumedThroughputUnits,
which measures combined read and write traffic. ConsumedThroughputUnits
is defined as the following:
-
Provisioned — (3 x consumed write capacity units) + consumed read capacity units
-
On-demand — (3 x write request units) + read request units
On the DynamoDB console, each data point in the graph represents the maximum of
ConsumedThroughputUnits over a 1-minute period. For example, a
graph value of 180,000 ConsumedThroughputUnits indicates that the item
was accessed continuously at the per-item maximum throughput of 1,000 write request
units or 3,000 read request units for a 60-second span within that 1-minute period
(3,000 x 60 seconds). In other words, the graphed values represent the
highest-traffic minute within each 1-minute period. You can change the time
granularity of the ConsumedThroughputUnits metric (for example, to view
5-minute metrics instead of 1-minute) on the CloudWatch console.
If you see several closely clustered lines without any obvious outliers, it indicates that your workload is relatively balanced across items over the given time window. If you see isolated points in the graph instead of connected lines, it indicates an item that was frequently accessed only for a brief period.
If your table or global secondary index has a sort key, DynamoDB creates two graphs: one for the most accessed partition keys and one for the most accessed partition + sort key pairs. You can see traffic at the partition key level in the partition key–only graph. You can see traffic at the item level in the partition + sort key graphs.
Most throttled items
This graph is available in both modes. Use this graph to identify the most
throttled items in the table or global secondary index. The graph displays
ThrottleCount on the y-axis and time on the x-axis. Each of the top
N keys is displayed in its own color, with a legend
displayed below the x-axis.
DynamoDB measures throttle frequency using ThrottleCount, which is the
count of ProvisionedThroughputExceededException,
ThrottlingException, and RequestLimitExceeded
errors.
Write throttling caused by insufficient write capacity for a global secondary index is not measured. You can use the Most Accessed Items graph of the global secondary index to identify imbalanced access patterns that may cause write throttling. For more information, see Provisioned throughput Considerations for Global Secondary Indexes.
On the DynamoDB console, each data point in the graph represents the count of throttle events over a 1-minute period.
If you see no data in this graph, it indicates that your requests are not being throttled. If you see isolated points in the graph instead of connected lines, it indicates that an item was frequently throttled for a brief period.
If your table or global secondary index has a sort key, DynamoDB creates two graphs: one for most throttled partition keys and one for most throttled partition + sort key pairs. You can see throttle count at the partition key level in the partition key-only graph, and throttle count at the item-level in the partition + sort key graphs.
Note
In throttled keys mode, this is the only type of graph you'll see. The absence of data in these graphs indicates healthy table performance with no throttling occurring.
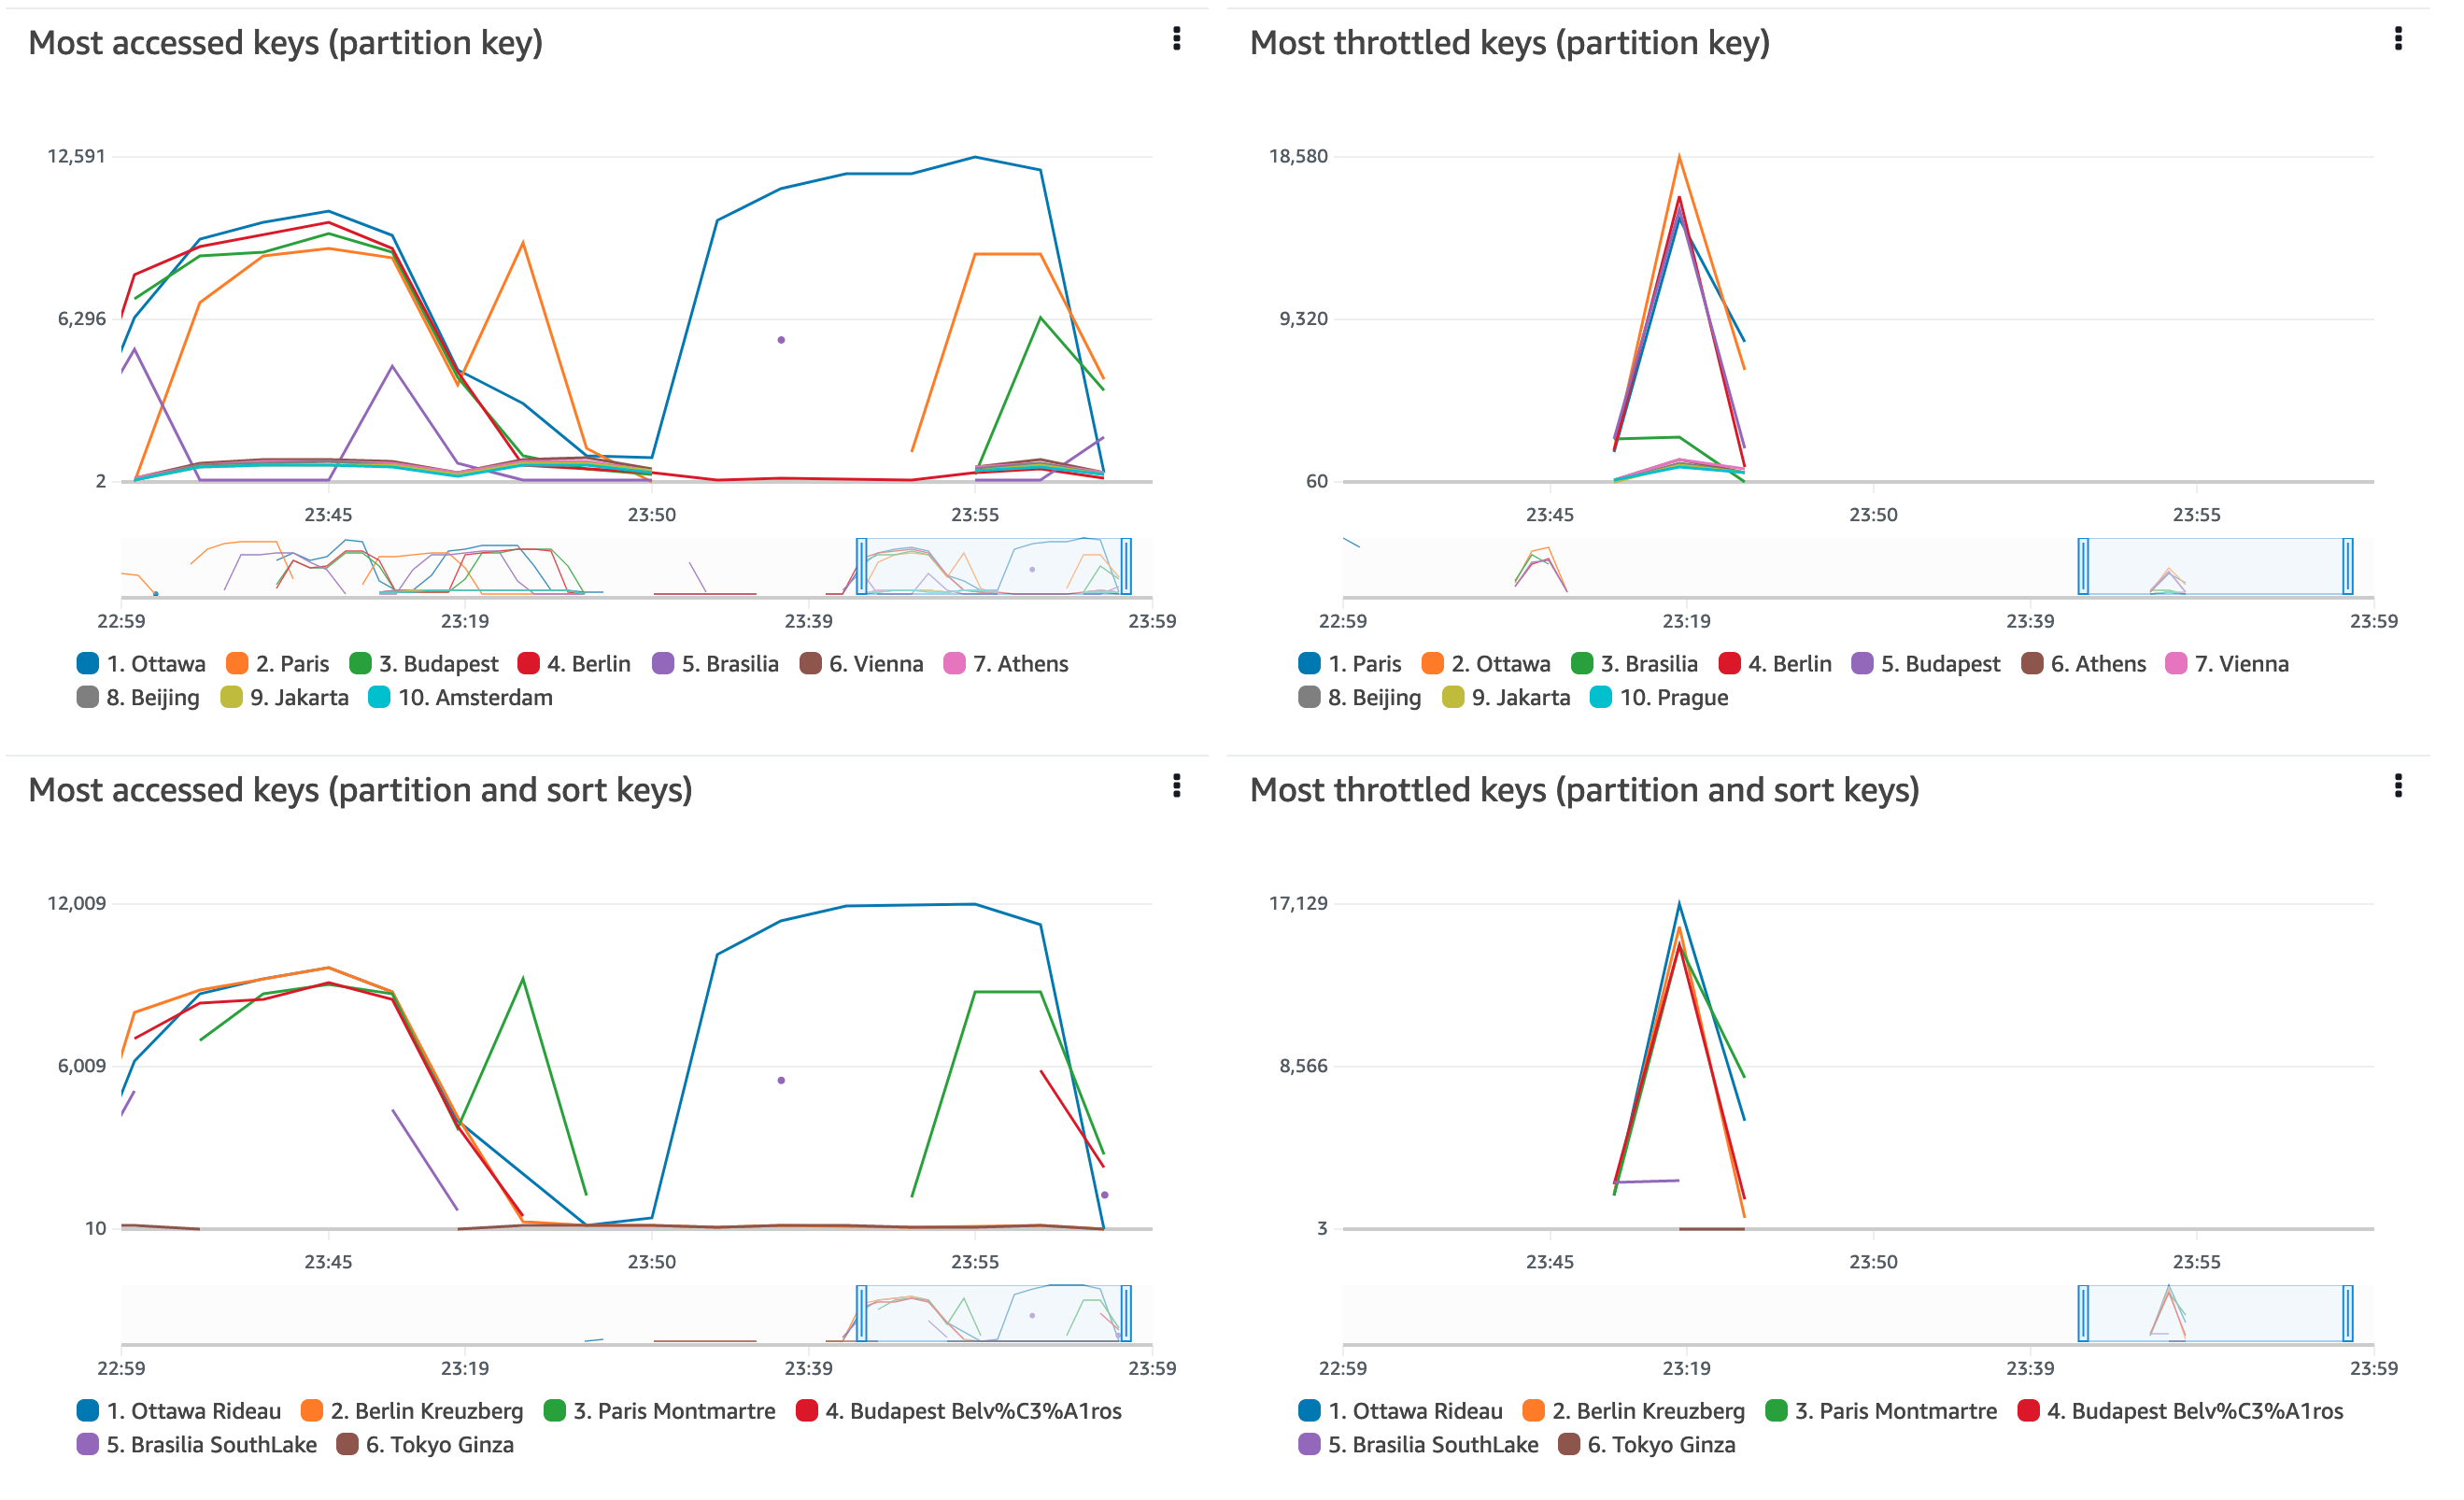
Report examples
The following example shows the reports generated for a table with both a partition key and sort key in accessed and throttled keys modes. In throttled keys mode, you see only the throttling-related portion of this report.
Interactions with other DynamoDB features
The following sections describe how CloudWatch Contributor Insights for DynamoDB behaves and interacts with several other features in DynamoDB. These behaviors apply to both modes unless otherwise specified.
Global tables
CloudWatch Contributor Insights for DynamoDB monitors global table replicas as distinct tables. The Contributor Insights graphs for a replica in one AWS Region might not show the same patterns as another Region. This is because write data is replicated across all replicas in a global table, but each replica can serve Region-bound read traffic.
Each replica can be configured with a different Contributor Insights mode independently. For example, you might use accessed and throttled keys mode in your primary region for comprehensive monitoring, while using throttled keys mode in secondary regions to maintain visibility into performance issues.
DynamoDB Accelerator (DAX)
CloudWatch Contributor Insights for DynamoDB doesn't show DAX cache responses. It only shows responses to accessing a table or a global secondary index.
Note
DynamoDB CloudWatch Contributor Insights does not support PartiQL requests.
Encryption at rest
CloudWatch Contributor Insights for DynamoDB doesn't affect how encryption works in DynamoDB. The primary key data that is published in CloudWatch is encrypted with the AWS owned key. However, DynamoDB also supports the AWS managed key and a customer managed key.
CloudWatch Contributor Insights for DynamoDB displays partition keys and sort keys (if applicable) of frequently accessed and throttled items. While CloudWatch Contributor Insights works with encrypted DynamoDB tables, it's important to note that it uses its own Amazon-owned encryption context, which is separate from the table's configured encryption.
If your DynamoDB table's primary key contains sensitive information and your organization's security policies require full control over encryption processes, enabling CloudWatch Contributor Insights may not be suitable.
Fine-grained access control
CloudWatch Contributor Insights for DynamoDB doesn't function differently for tables with fine-grained access control (FGAC). In other words, any user who has the appropriate CloudWatch permissions can view FGAC-protected primary keys in CloudWatch Contributor Insights graphs.
If the table's primary key contains FGAC-protected data that you don't want published to CloudWatch, you should not enable CloudWatch Contributor Insights for DynamoDB for that table.
Access control
You control access to CloudWatch Contributor Insights for DynamoDB using AWS Identity and Access Management (IAM) by limiting DynamoDB control plane permissions and CloudWatch data plane permissions. For more information see, Using IAM with CloudWatch Contributor Insights for DynamoDB.
CloudWatch contributor insights for DynamoDB billing
Charges for CloudWatch Contributor Insights for DynamoDB appear in the CloudWatch
Billing by mode
The two Contributor Insights modes have different billing characteristics.
-
Accessed and throttled keys mode billing - In this mode, each item that is written or read via a data plane operation represents one event, regardless of whether the request succeeds or is throttled. If a table or global secondary index includes a sort key, each item that is read or written represents two events. This is because DynamoDB is identifying top contributors from separate time series: one for partitions keys only, and one for partition and sort key pairs.
-
Throttled keys mode billing - In this mode, only throttled requests generate billable events. Events are only generated when requests result in
ProvisionedThroughputExceededException,ThrottlingException, orRequestLimitExceedederrors. If a table or global secondary index includes a sort key, each throttled item represents two events (partition key tracking and partition + sort key tracking).
Billing examples
For example, assume that your application performs the following DynamoDB operations:
a GetItem, a PutItem, and a BatchWriteItem
that puts five items. Also assume that the PutItem operation gets
throttled, but all other operations succeed.
-
Accessed and throttled keys mode
-
If your table or global secondary index has only a partition key, it results in 7 events (1 for the
GetItem, 1 for thePutItem, and 5 for theBatchWriteItem). -
If your table or global secondary index has a partition key and sort key, it results in 14 events (2 for the
GetItem, 2 for thePutItem, and 10 for theBatchWriteItem).
-
-
Throttled keys mode
-
If your table or global secondary index has only a partition key, it results in 1 event (only for the throttled
PutItem). -
If your table or global secondary index has a partition key and sort key, it results in 2 events (2 for the throttled
PutItem).
The successful
GetItemandBatchWriteItemoperations generate no events in throttled keys mode. -
Common billing factors
AQuery operation always results in 1 event, regardless of the mode or
number of items returned.
Unlike other DynamoDB features, CloudWatch Contributor Insights for DynamoDB billing does not vary based on the following:
-
The capacity mode (provisioned vs. on-demand)
-
Whether you perform read or write requests
-
The size (KB) of the items read or written
