Viewing App Runner service metrics reported to CloudWatch
Amazon CloudWatch monitors your Amazon Web Services (AWS) resources and the applications you run on AWS in real time. You can use CloudWatch to collect and track metrics, which are variables you can measure for your resources and applications. You can also use it to create alarms that watch metrics. When a certain threshold is reached, CloudWatch sends notifications, or automatically makes changes to the monitored resources. For more information, see the Amazon CloudWatch User Guide.
AWS App Runner collects a variety of metrics that provide you with greater visibility into the usage, performance, and availability of your App Runner services. Some metrics track individual instances that run your web service, whereas others are at the overall service level. The following sections list App Runner metrics and show you how to view them in the App Runner console.
App Runner metrics
App Runner collects the following metrics relating to your service and publishes them to CloudWatch in
the AWS/AppRunner namespace.
Note
Prior to August 23, 2023, the CPU utilization and Memory utilization metrics were based on vCPU units and megabytes of memory utilized, instead of percent utilization, as calculated today. If your application ran on App Runner before this date, and you choose to go back to view metrics for this date on either the App Runner or the CloudWatch console, you'll see a display of the metrics in both units and will also see some irregularities as a result.
Important
You'll need to update any CloudWatch alarms that are based on the CPU utilization and Memory utilization metric values prior to August 23, 2023. Update the alarms to trigger based on percentage utilization rather than vCPU or megabytes. For more information, see the Amazon CloudWatch User Guide.
Instance level metrics are collected for each instance (scaling unit) individually.
| What's measured? | Metric | Description |
|---|---|---|
|
CPU utilization |
|
The percentage of average CPU usage during one-minute periods out of the total CPU usage reserved by the service configuration. |
|
Memory utilization |
|
The percentage of average memory usage during one-minute periods out of the total memory reserved by the service configuration. |
Service level metrics are collected for the entire service.
| What's measured? | Metric | Description |
|---|---|---|
|
CPU utilization |
|
The percentage of aggregated CPU usage across all instances during one minute periods out of the total CPU usage reserved by the service configuration. |
|
Memory utilization |
|
The percentage of aggregated memory usage across all instances during one minute periods out of the total memory reserved by the service configuration. |
|
Concurrency |
|
The approximate number of concurrent requests being handled by the service. |
|
HTTP request count |
|
The number of HTTP requests that the service received. |
|
HTTP status counts |
|
The number of HTTP requests that returned each response status, grouped by category (2XX, 4XX, 5XX). |
|
HTTP request latency |
|
The time, in milliseconds, that it took your web service to process HTTP requests. |
|
Instance counts |
|
The number of instances that are processing HTTP requests for your service. Note If the |
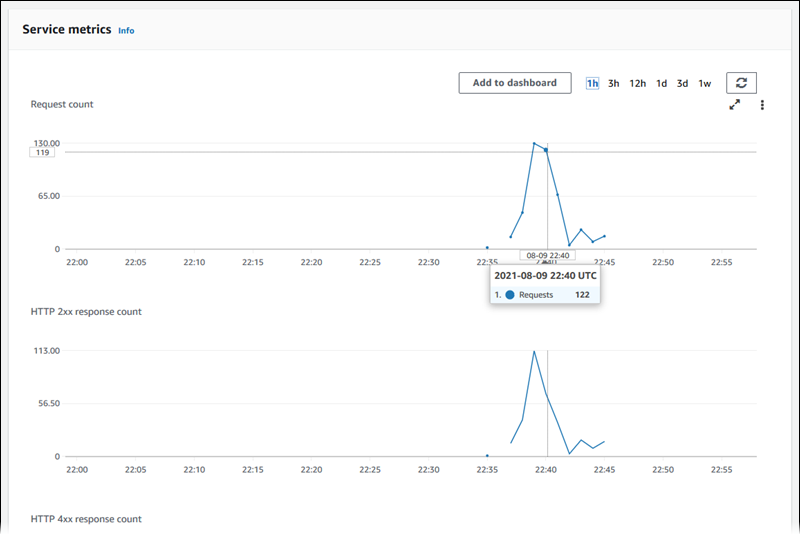
Viewing App Runner metrics in the console
The App Runner console graphically displays the metrics that App Runner collects for your service and provides more ways to explore them.
Note
At this time, the console displays only service metrics. To view instance metrics, use the CloudWatch console.
To view logs for your service
-
Open the App Runner console
, and in the Regions list, select your AWS Region. -
In the navigation pane, choose Services, and then choose your App Runner service.
The console displays the service dashboard with a Service overview.

-
On the service dashboard page, choose the Metrics tab.
The console displays a set of metrics graphs.
-
Choose a duration (for example, 12h) to scope metrics graphs to the recent period of that duration.
-
Choose Add to dashboard at the top of one of the graph sections, or use the menu on any graph, to add the relevant metrics to a dashboard in the CloudWatch console for further investigation.
