View statistics and execution details for completed queries
After you run a query, you can get statistics on the input and output data processed, see a graphical representation of the time taken for each phase of the query, and interactively explore execution details.
To view query statistics for a completed query
-
After you run a query in the Athena query editor, choose the Query stats tab.
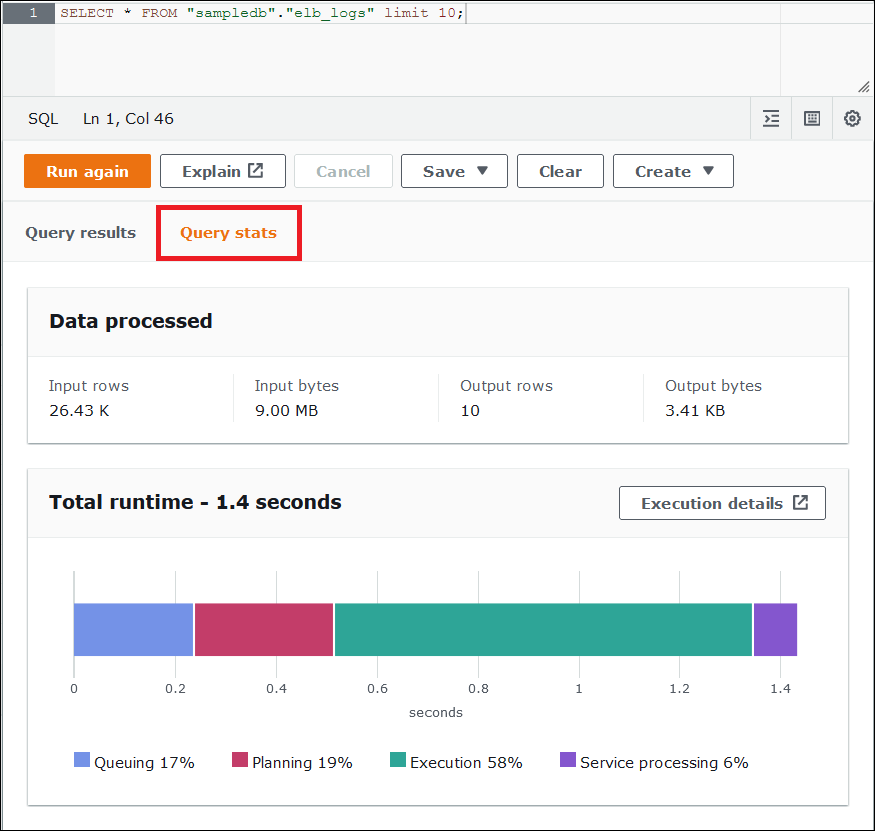
The Query stats tab provides the following information:
-
Data processed – Shows you the number of input rows and bytes processed, and the number of rows and bytes output.
-
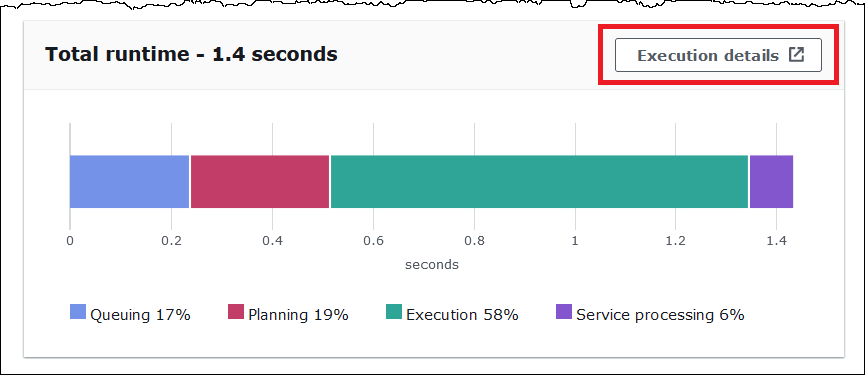
The Total runtime – Shows the total amount of time the query took to run and a graphical representation of how much of that time was spent on queuing, planning, execution, and service processing.
Note
Stage-level input and output row count and data size information are not shown when a query has row-level filters defined in Lake Formation.
-
-
To interactively explore information about how the query ran, choose Execution details.
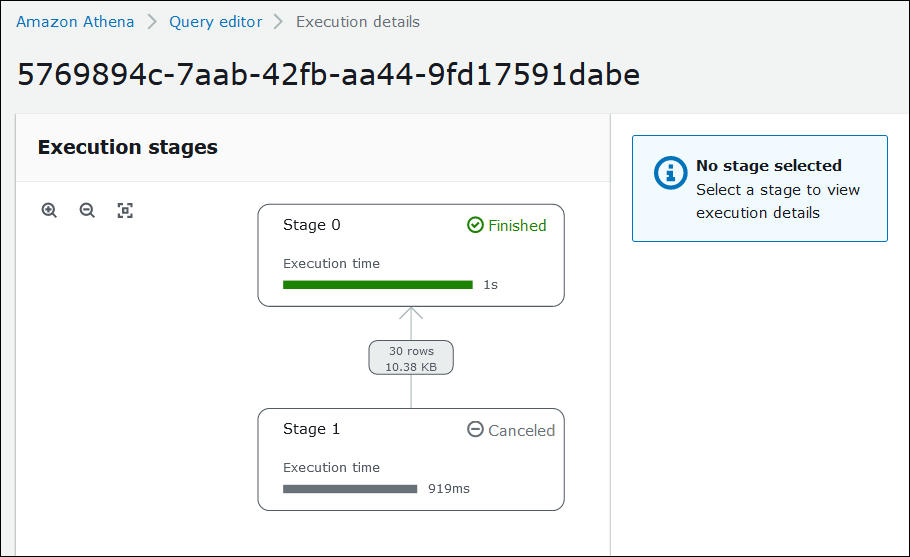
The Execution details page shows the execution ID for the query and a graph of the zero-based stages in the query. The stages are ordered start to finish from bottom to top. Each stage's label shows the amount of time the stage took to run.
Note
The total runtime and execution stage time of a query often differ significantly. For example, a query with a total runtime in minutes can show an execution time for a stage in hours. Because a stage is a logical unit of computation executed in parallel across many tasks, the execution time of a stage is the aggregate execution time of all of its tasks. Despite this discrepancy, stage execution time can be useful as a relative indicator of which stage was most computationally intensive in a query.
To navigate the graph, use the following options:
-
To zoom in or out, scroll the mouse, or use the magnifying icons.
-
To adjust the graph to fit the screen, choose the Zoom to fit icon.
-
To move the graph around, drag the mouse pointer.
-
-
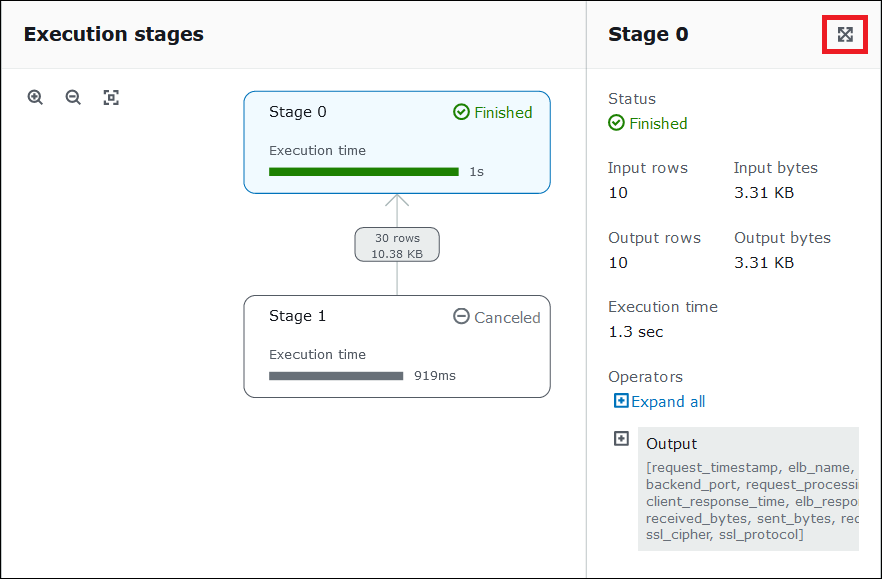
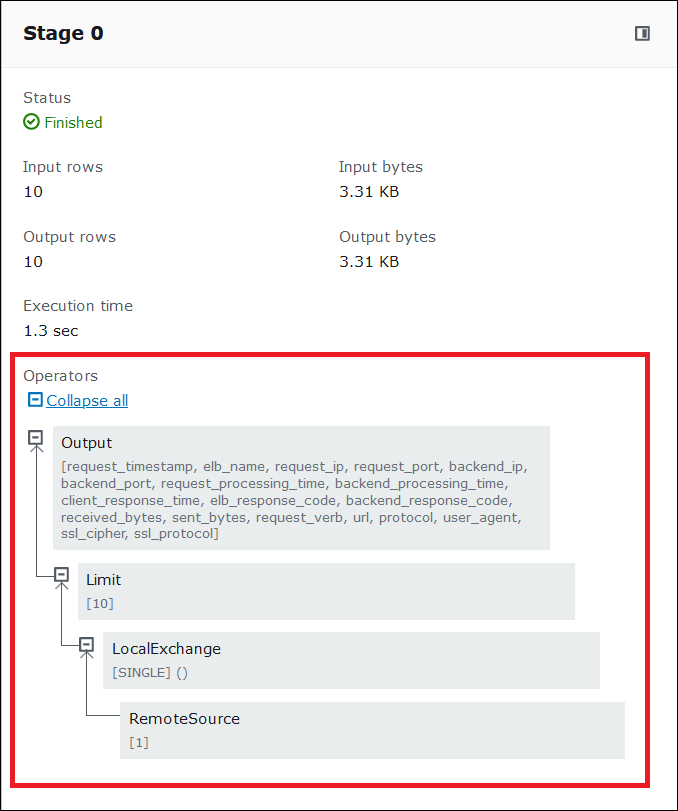
To see more details for a stage, choose the stage. The stage details pane on the right shows the number of rows and bytes input and output, and an operator tree.
-
To see the stage details full width, choose the expand icon at the top right of the details pane.
-
To get information about the parts of the stage, expand one or more items in the operator tree.
For more information about execution details, see Understand Athena EXPLAIN statement results.
Additional resources
For more information, see the following resources.
View execution plans for SQL queries
Using EXPLAIN and EXPLAIN ANALYZE in Athena
