Creating new analysis
To create a new analysis, follow the below procedure.
Note
Granular access based on Location and Product is not supported in AWS Supply Chain Analytics.
On the QuickSight dashboard page, choose New analysis.
Choose New dataset
The Create a Dataset page appears. You will see the AWS Supply Chain data lake as an existing dataset for you to pick. For example, ask-datalake-your instance id.
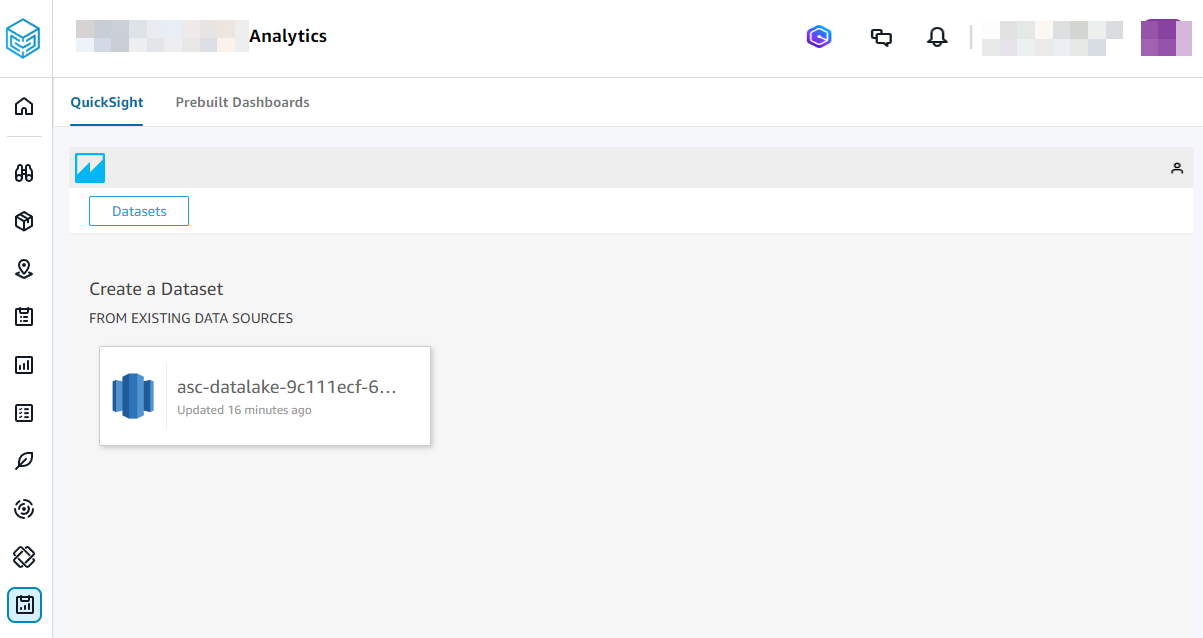
Choose the data source.
Note
Select the blue QuickSight logo to navigate to the QuickSight menu to view the datasets or analyses.
Choose Create dataset.
Under Schema:contain set of tables drop-down, select one of the following data source names:
asc_data_<your instance id>: Contains datasets processed and transformed by AWS Supply Chain for use within the application. These can be used for creating dashboards and custom analyses. Examples include asc_insights_order_insights and asc_adp_forecast. For more information on available datasets and their uses, see Application datasets used in AWS Supply Chain Analytics.
asc_custom_data_<your instance id>: Contains original, non-transformed data as provided. You can query these datasets to access and analyze your raw data directly and build dashboards out of them.
Under Tables: contain the data you can visualize, choose the dataset from the list of AWS Supply Chain datasets.
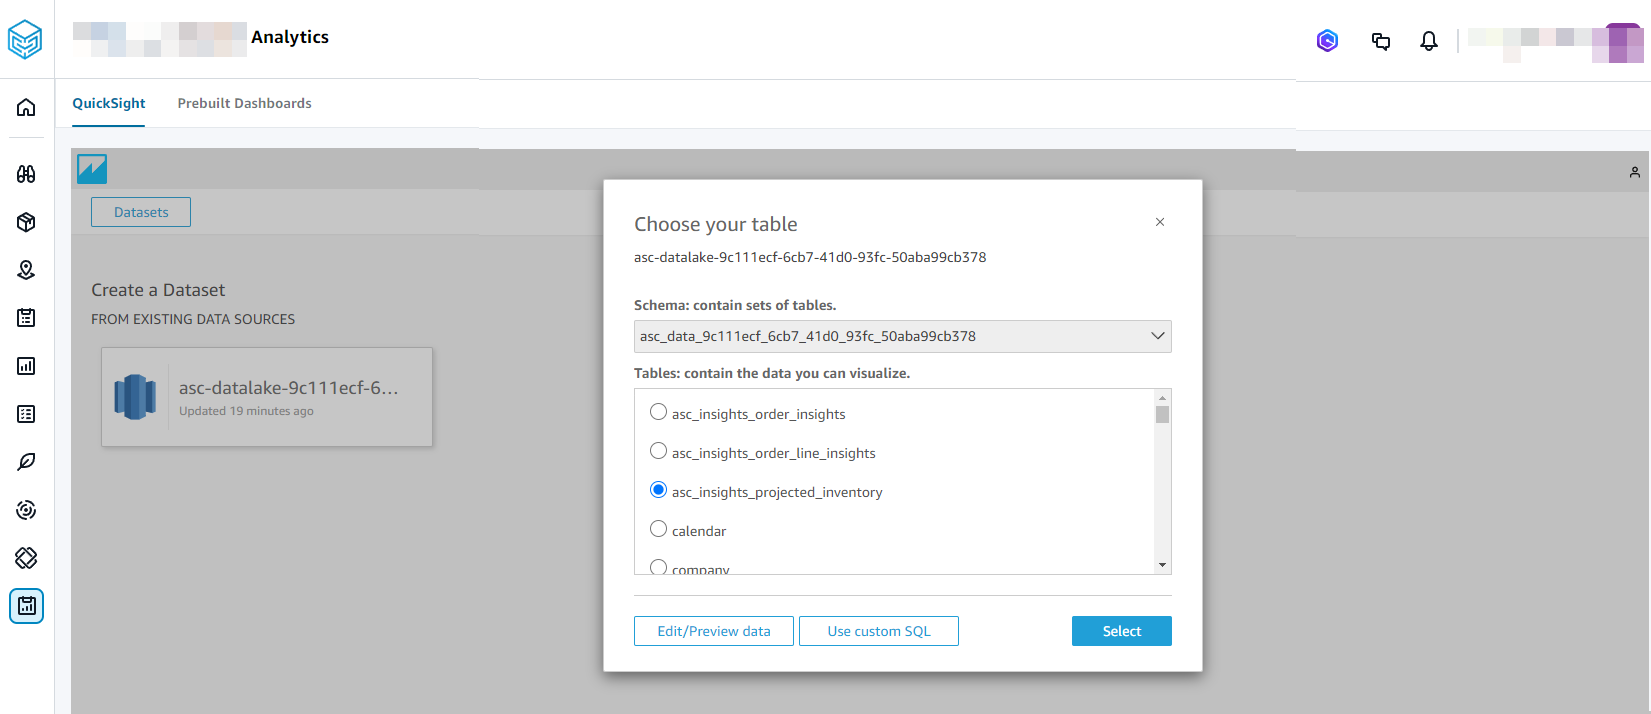
Choose Select.
Under Finish dataset creation, choose Visualize.
Under Data, choose the fields you want to visualize and choose Publish.
The Publish a dashboard page appears.
Under Publish new dashboard as, enter a name for your dashboard.
Choose Publish dashboard.
You will see the new dashboard created under Dashboards and a new analysis created under Analyses. For more information on using Dashboards or Analyses, see Amazon QuickSight.
