View CodeBuild metrics
AWS CodeBuild monitors functions on your behalf and reports metrics through Amazon CloudWatch. These metrics include the number of total builds, failed builds, successful builds, and the duration of builds.
You can use the CodeBuild console or the CloudWatch console to monitor metrics for CodeBuild. The following procedures show you how to view metrics.
View build metrics (CodeBuild console)
Note
You can't customize the metrics or the graphs used to display them in the CodeBuild console. If you want to customize the display, use the Amazon CloudWatch console to view your build metrics.
Account-level metrics
To view AWS account-level metrics
-
Sign in to the AWS Management Console and open the AWS CodeBuild console at https://console.aws.amazon.com/codesuite/codebuild/home
. -
In the navigation pane, choose Account metrics.
Project-level metrics
To view project-level metrics
-
Sign in to the AWS Management Console and open the AWS CodeBuild console at https://console.aws.amazon.com/codesuite/codebuild/home
. -
In the navigation pane, choose Build projects.
-
In the list of build projects, in the Name column, choose the project where you want to view metrics.
-
Choose the Metrics tab.
View build metrics (Amazon CloudWatch console)
You can customize the metrics and the graphs used to display them with the CloudWatch console.
Account-level metrics
To view account-level metrics
Sign in to the AWS Management Console and open the CloudWatch console at https://console.aws.amazon.com/cloudwatch/
. -
In the navigation pane, choose Metrics.
-
On the All metrics tab, choose CodeBuild.
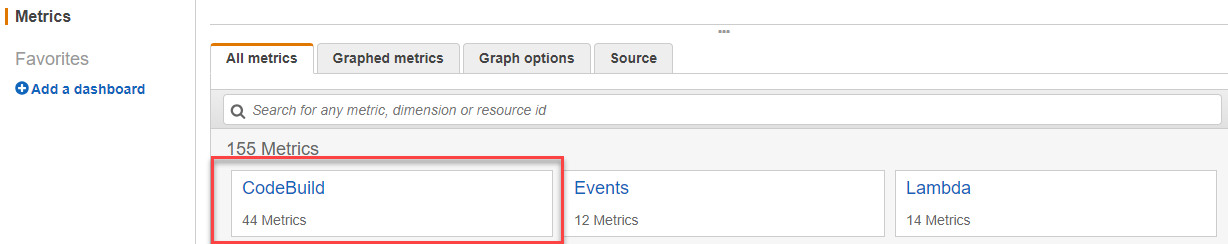
-
Choose Account Metrics.
-
Choose one or more projects and metrics. For each project, you can choose the SucceededBuilds, FailedBuilds, Builds, and Duration metrics. All selected project and metric combinations are displayed in the graph on the page.
Project-level metrics
To view project-level metrics
Sign in to the AWS Management Console and open the CloudWatch console at https://console.aws.amazon.com/cloudwatch/
. -
In the navigation pane, choose Metrics.
-
On the All metrics tab, choose CodeBuild.
-
Choose By Project.
-
Choose one or more project and metric combinations. For each project, you can choose the SucceededBuilds, FailedBuilds, Builds, and Duration metrics. All selected project and metric combinations are displayed in the graph on the page.
-
(Optional) You can customize your metrics and graphs. For example, from the drop-down list in the Statistic column, you can choose a different statistic to display. Or from the drop-down menu in the Period column, you can choose a different time period to use to monitor the metrics.
For more information, see Graph metrics and View available metrics in the Amazon CloudWatch User Guide.
