Set up in the CodeGuru Profiler console
Step 1: Sign up for AWS
When you sign up for Amazon Web Services (AWS), your AWS account is automatically signed up for all services in AWS, including CodeGuru Profiler. You're charged only for the services that you use.
If you have an AWS account already, move on to the next task. If you don't have an AWS account, use the following procedure to create one.
To create an AWS account
Follow the online instructions.
Part of the sign-up procedure involves receiving a phone call or text message and entering a verification code on the phone keypad.
When you sign up for an AWS account, an AWS account root user is created. The root user has access to all AWS services and resources in the account. As a security best practice, assign administrative access to a user, and use only the root user to perform tasks that require root user access.
Step 2: Create a CodeGuru Profiler profiling group
A profiling group can profile one or more applications. Data is aggregated and displayed based on the whole profiling group.
For example, if you have a collection of microservices that handle restaurant recommendations, you can collect profile data and identify performance issues across all these microservices in a single profiling group named "Restaurant-Recommendations".
To create a profiling group from the CodeGuru Profiler console
-
Sign in to the AWS Management Console, and then open the CodeGuru Profiler console at https://console.aws.amazon.com/codeguru/profiler
. -
In the navigation pane on the left, choose Profiler, and then choose Profiling groups.
-
On the Profiling groups page, choose Create profiling group.
-
Provide a Name for the new profiling group. Choose the compute platform that on which your applications are running. If your applications run on AWS Lambda, choose the AWS Lambda option. Choose Other if your applications run on a compute platform other than AWS Lambda, such as Amazon EC2, on-premises servers, or a different platform.
-
Choose Create profiling group.
Step 3: Set permissions
The CodeGuru Profiler profiling agent needs permissions to write data to the profiling group.
You can add the necessary permissions by adding the following policy.
arn:aws:iam::aws:policy/AmazonCodeGuruProfilerAgentAccess
To set permissions for the new CodeGuru Profiler agent:
-
Start by choosing Give access to users and roles. Choose the IAM users and roles that can submit profiling data and configure the agent.
-
If your applications run on AWS Lambda, choose the role that your AWS Lambda function uses.
-
After you grant permissions for a user or role, you don't need to attach IAM policies for agent permissions.

Use
IAM:ListUsersandIAM:ListRolespermissions to see your users and roles. Otherwise, you can add a user or Amazon Resource Name (ARN) role. You'll see the following message.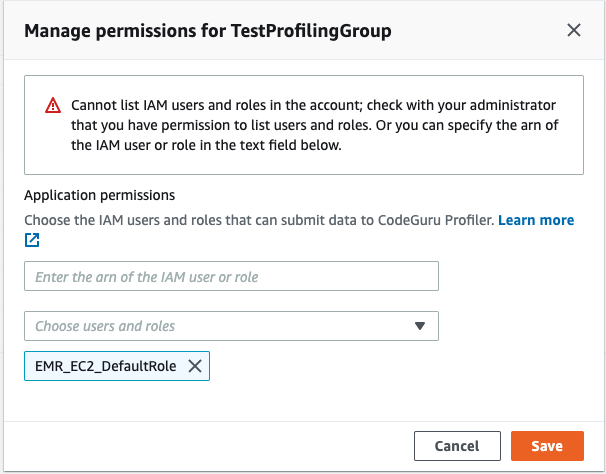
Alternatively, you can add a policy like the following to the role that your application uses. For more information about roles, see Modifying a role.
{
    "Version": "2012-10-17",
    "Statement": [
        {
            "Effect": "Allow",
            "Action": [
                "codeguru-profiler:ConfigureAgent",
                "codeguru-profiler:PostAgentProfile"
            ],
            "Resource": "arn:aws:codeguru-profiler:<region>:<accountID>:profilingGroup/<profilingGroupName>"
        }
    ]
}
If your application is running in a Region that CodeGuru Profiler doesn't support and if you have the appropriate permissions, you can submit profiling data to one of the supported Regions. For more information about using CodeGuru Profiler in a Region it doesn't support, see Working with unsupported Regions.
Step 4: Start CodeGuru Profiler in your application
Run your application with the profiling agent
Run your application with the CodeGuru Profiler profiling agent. You can use CodeGuru Profiler on your Python or Java virtual machine (JVM)-based applications.
For your JVM-based application, you can either start the agent as a JVM agent, or start it manually with a code change in your application. To start profiling your application, see Integrating with JVM.
To start profiling your Python application, see Integrating with Python.
Enable data collection for the heap summary visualization
The CodeGuru Profiler heap summary shows your application's heap usage over time. This feature is available for JVM applications. For more information on the heap summary, see Understanding the heap summary.
Heap summary collection requires Java agent version 1.2.3 or greater. Opt in to heap summary data collection by completing the onboarding method used to enable the agent. The following are the onboarding methods from which you can choose.
Command line (-javaagent)
Add heapSummaryEnabled:true. The following example shows how to enable
heap summary collection.
-javaagent:/path/to/codeguru-profiler-java-agent-standalone-1.2.3.jar="profilingGroupName:myProfilingGroup,heapSummaryEnabled:true"
Update your code
Set .withHeapSummary to true. The following is an example
of what your code might look like.
class MyClass {
    public static void main(String[] args) {
        Profiler.builder()
            .profilingGroupName("MyProfilingGroup")
            .withHeapSummary(true) // optional - to start without heap profiling set to false or remove line
            .build()
            .start();
        ...
    }
Environment variables
Set AWS_CODEGURU_PROFILER_HEAP_SUMMARY_ENABLED to
true.
