Comparing two time ranges
The CodeGuru Profiler Compare option allows you to view differences between two different time ranges of the same profiling group. It can be used for overview, hotspots, and inspect visualizations. This feature is not available for the heap summary visualization.
To enable the compare visualization
-
Choose Compare.
-
Set B to be the time to which you want to compare to your current visualization.
-
Choose Apply.
If you'd like to change the time range comparison, choose Change B.
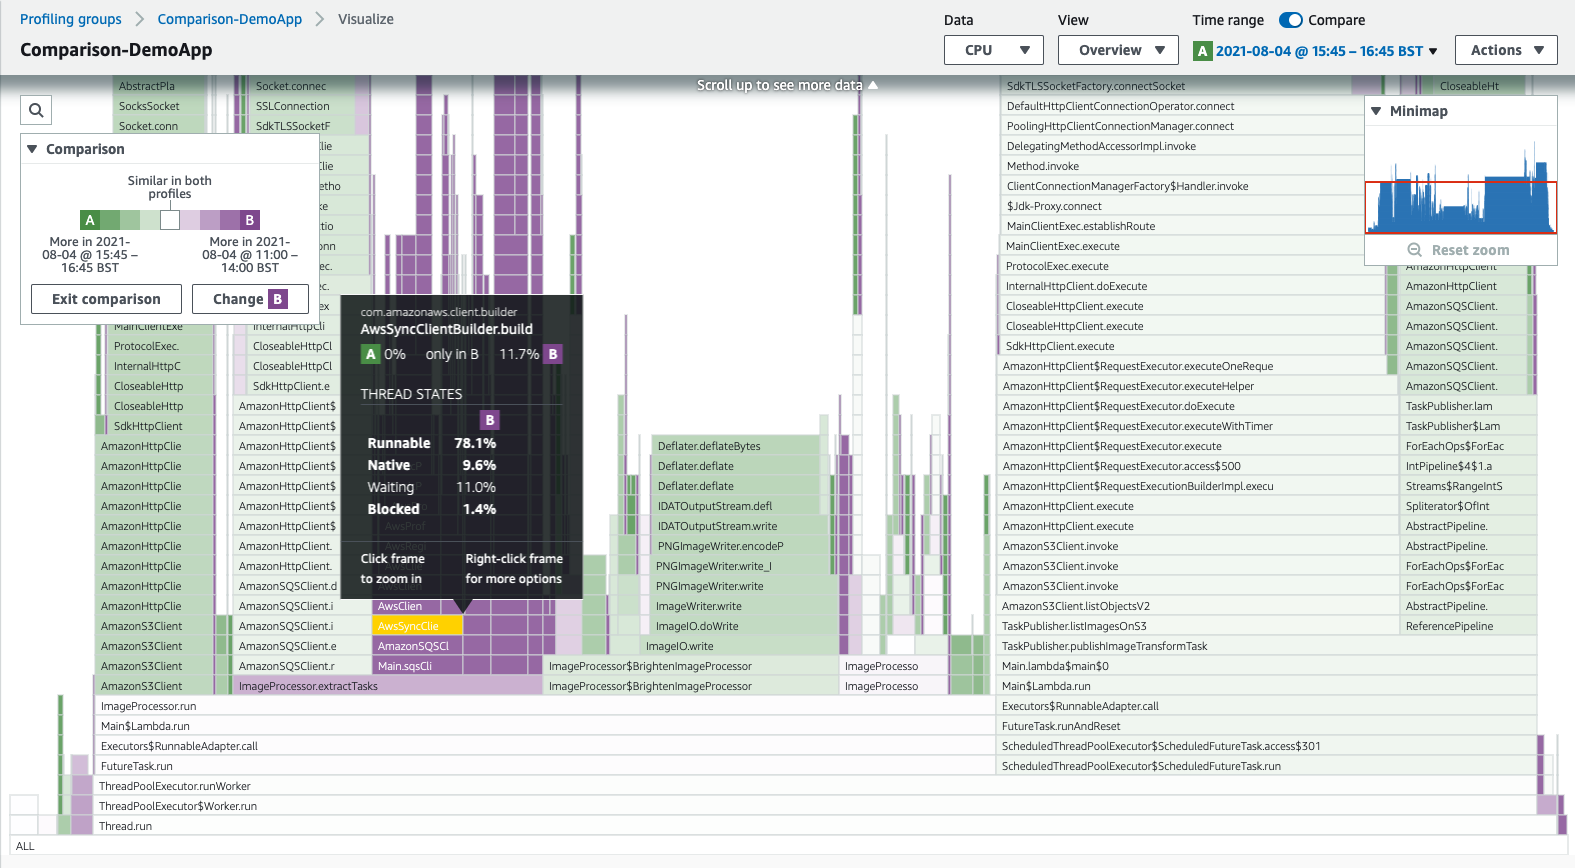
These comparisons are visualized by color. Functions that take more time in one time range appear more prominently as the color of the corresponding time range. Less saturated colors indicate a smaller difference between the two time ranges. A very light or white color indicates little to no difference between the time ranges.
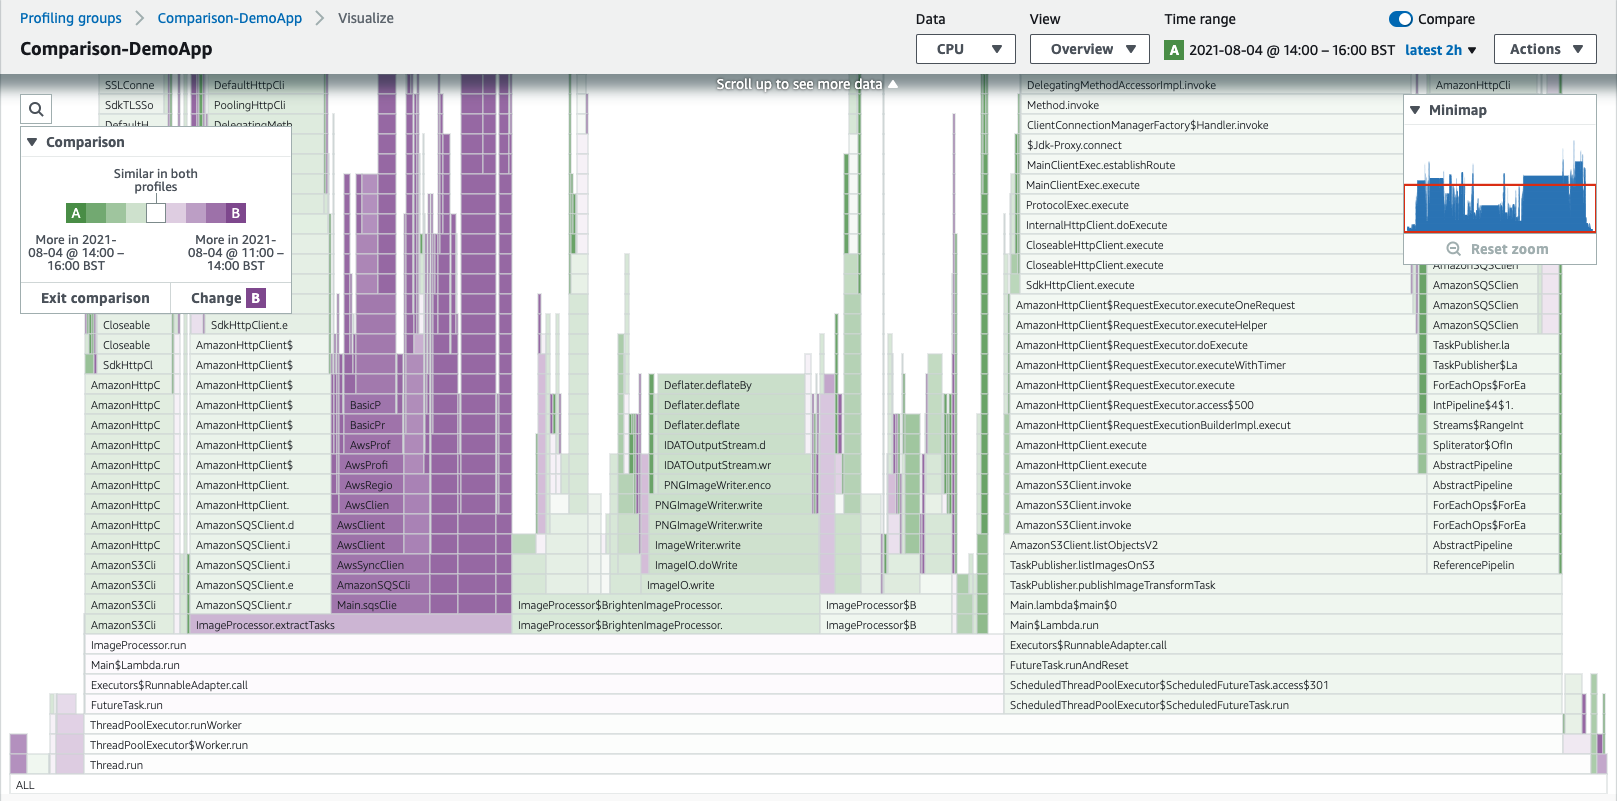
In this example, the two time ranges are A (green) and B (purple). The visualization allows you to pinpoint the areas in darker violet that indicate the function took more time in time range B. Similarly, the darker green indicates functions spending more time in time range A. The more faded sections of the visualization indicate a similar amount of time was taken by the function in both time ranges.
Understanding the comparison
You can see more information about a function if you pause over it. In the following example, you can see the CPU cost reduced betwen the first time range and the second.
Note
It's normal to see changes in your profiling data without any code changes. The profiling data may vary depending on when and how your application runs. Keep in mind your application characteristics when selecting a comparison time range. For example, you might find interesting profiling data if you compare data from your current time range with the data from a week earlier.