Selecting and coloring thread states
In a visualization view, you can filter profiling data by thread state. You can color thread states inside of stack frames to make it easy to spot how the application is behaving. You can also select which thread states are displayed.
Note
The CPU view and latency view were not supported for first release of Python applications; if you open old Python profiles from before February 2021, the profiling data represents wall clock time percentages for each frame. This is similar to the latency view, without the different thread states and colors. On recent Python profiles the different views work normally.
CPU view – The default thread state view for visualizations,
it's useful to try to reduce CPU utilization. It displays frames for thread states that
correspond to CPU usage: RUNNABLE, BLOCKED, and
NATIVE. In this view, the different shades of coloring simply help with
visualization, and are based on the frame names.
Latency view – Useful to try to improve the latency of all or
part of your application. When you select it, the visualization displays frames for all of
the thread states except IDLE. All of these threads might contribute to
latency. Frames in the visualization are colored based on the thread state.
Custom view – You can choose to select the thread states for frames to include in the visualization. The threads you can select are the ones found in your profile data. You can also choose whether to color the frames based on thread states.
Example of differences between CPU view and latency view
| CPU view | Latency view |
|---|---|
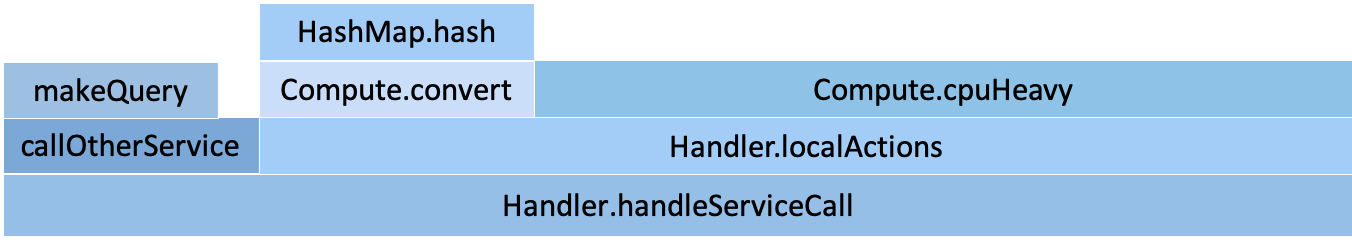
|
|
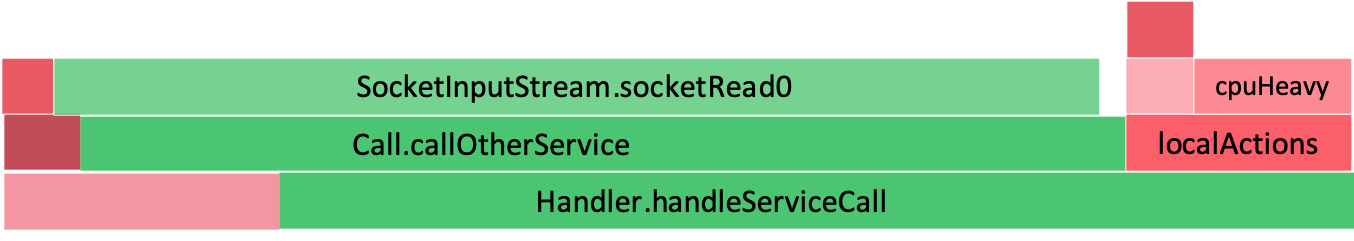
The callOtherService function appears smaller in the
CPU view because it's not showing the time when the thread was in a
waiting state. In the Latency view, we still see the part where the
CPU was active (in red), but we also see when the threads were waiting (in green).
If you're trying to reduce your CPU usage, the CPU view shows you
that localActions is the most CPU heavy inside
handleServiceCall, and you might want to optimize this part.
If you're trying to improve the latency of handleServiceCall, the
Latency view shows you that most of the time is spent in
callOtherService. You can check if this is expected and try to reduce the
number of calls or speed up the execution of calls (for example, caching or batching the
requests, or calling a closer AWS Region).
