Inspect a forecast in Amazon Connect
You can inspect your forecasts before publishing them. You can do this in the online Amazon Connect admin website, or download the forecasts for offline analysis.
To help make it easier to inspect a forecast in the Amazon Connect admin website, the forecast data is displayed in both a graph and a table. Use the controls on the report settings panel and calendar picker to adjust and filter the data for a more granular view. For example, you can:
-
Use the calendar to change the horizon. You can zoom into specific dates.
-
Choose 15 minute intervals if your date range is less than a week. This enables you to see the exact contact pattern of the day.
-
Compare Last computed forecast and Last published forecast as shown in the following image.
-
Compare Actuals and forecasts to identify any abnormalities in either the line chart or the "Variance" chart. The following image shows the forecast data is displayed as graphs.
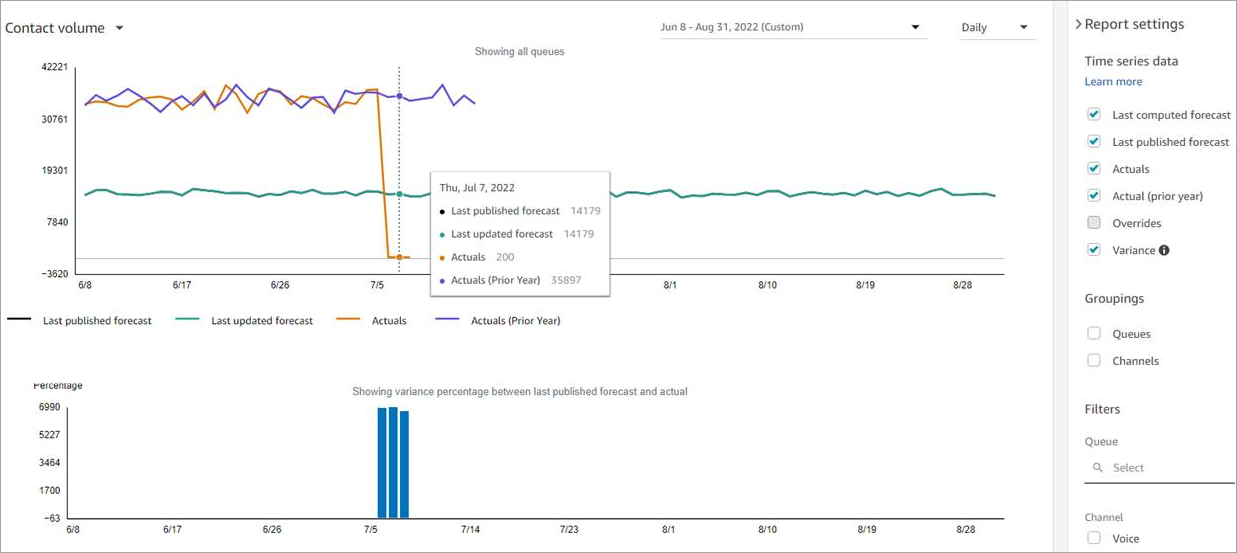
Choose the Override setting to inspect the effect of any override you uploaded. The Override option is active only after an override has been uploaded. For more information, see Edit a forecast.
-
Filter by queues or channels to limit your forecast to one or more type.
