What is AWS X-Ray?
AWS X-Ray provides trace information about any received responses and calls that an instrumented application makes, including to the following:
-
Downstream AWS resources
-
Microservices
-
Databases
-
Web APIs
Use trace data and visualizations to gain insights into your application's performance, identify issues, and find opportunities for optimization. Use analysis tools in X-Ray to view, filter, and investigate details for any traced request to your application.
How X-Ray works
To use X-Ray, you must first instrument your application so that X-Ray can track how your application handles a request. Adding instrumentation to your application lets X-Ray send trace data and metadata for incoming and outbound requests and other events within your application. For example, you can instrument all incoming HTTP requests and downstream calls to AWS services that your Java application makes. You can also instrument your application automatically. For more information, see Instrumenting your application for more information.
X-Ray assigns a trace id to any request that your instrumented application receives. If your application interacts with another component, X-Ray creates a segment. This segment is associated with the original trace id and tracks the quality of the interaction with that component.
X-Ray tracks the trace id and segments throughout your entire application workflow. You can analyze the entire workflow or isolate a piece for detailed analysis. For more information about segments, see the following Concepts section.
X-Ray tracks your application as it interacts with service nodes, or components, to serve an incoming request as follows:
-
X-Ray uses a trace id and segments to track individual interactions.
-
An AWS agent collects the trace id and associated segments, and then passes them to an SDK or API trace framework.
-
X-Ray also tracks interactions with any AWS services that integrate with X-Ray.
-
The agent sends data to a console GUI, where you can view information about your traces, segments and subsegments, and how these components interact.
The previous steps are shown in the following diagram:
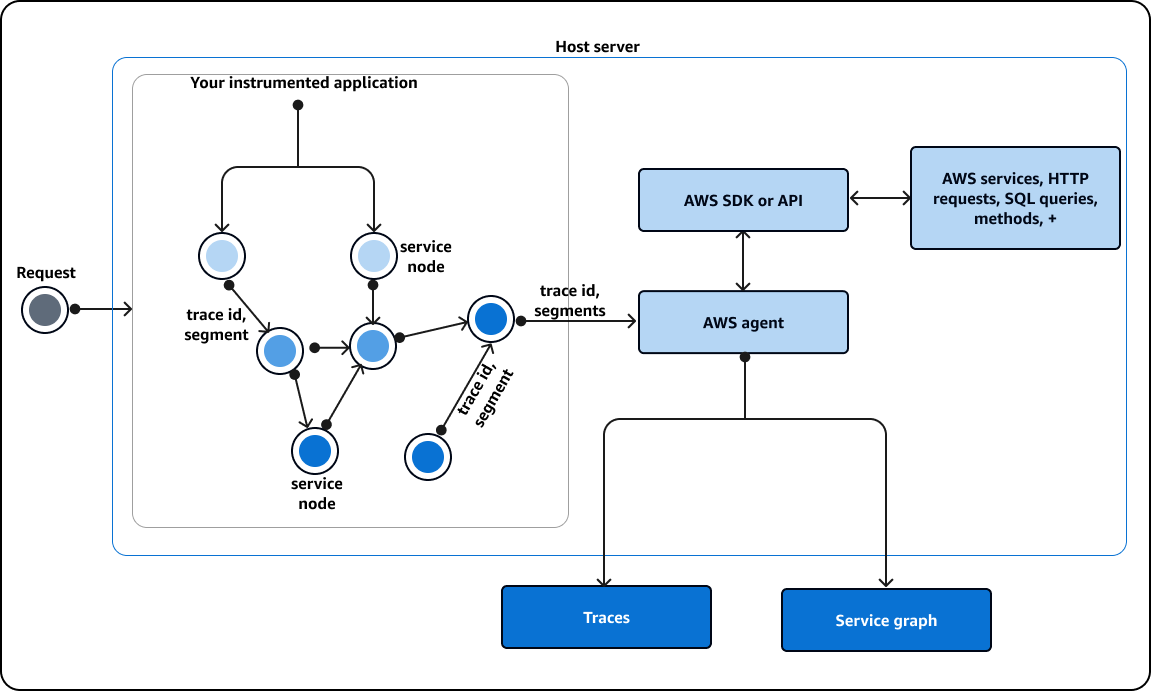
How X-Ray interacts with your instrumented application
When your instrumented application receives a request, X-Ray does the following:
-
After your application serves the request, the X-Ray SDK sends trace data to an AWS collector or agent. Then, the agent collects the trace id and segments. You can choose from the following three agents:
-
AWS Distro for OpenTelemetry (ADOT) collector – An open-source collector that is optimized and secured by AWS, based on an open-source standardized OpenTelemetry agent
. Use the ADOT collector if you want to use language and vendor-agnostic standardized code to interact with an agent but still have the confidence of AWS security and optimization built into the end product. You can also use ADOT to configure an endpoint to different agents and backends. -
Amazon CloudWatch agent – An open-source collector that integrates logs, metrics and traces, supports all telemetry data, and has the ADOT collector integrated into it.
-
X-Ray daemon – A legacy collector that works with the X-Ray SDK and X-Ray APIs. Use the X-Ray daemon if you have legacy code, or have an application that requires customized tracing and thus must use the X-Ray APIs. The daemon is available for Linux, Microsoft Windows, and macOS, and is included on AWS Elastic Beanstalk and AWS Lambda platforms. AWS no longer developes the X-Ray daemon.
-
-
Then, the agent sends this data to a tracing framework that consists of either an AWS API, or an AWS SDK that is built on top of an API. This framework interacts with other AWS services. The X-Ray API provides access to all X-Ray functionality through the AWS SDK, AWS Command Line Interface, or directly over HTTPS. Use the X-Ray API if you are using a language or need an operation that is not supported by an SDK.
You can use the following SDKs:
-
The ADOT SDK – Use the ADOT SDK to interact with different agents from vendors that are not affiliated with AWS. The ADOT SDK also supports multiple backend services.
-
The X-Ray SDK – A legacy product that is no longer adding more features or languages. Use the X-Ray SDK if you don’t want to update your application code.
If you are using an SDK, you have the following options, in combination with an agent:
-
Use the ADOT SDK with a CloudWatch agent – recommended.
-
Use the ADOT SDK with an ADOT agent – recommended if you want to use vendor agnostic software with AWS layers of security and optimization.
-
Use the X-Ray SDK with the X-Ray daemon – Use this if you don't want to update your application code.
-
Use the X-Ray SDK with a CloudWatch agent – The CloudWatch agent is backwards compatible with the X-Ray SDK.
-
-
(Optional) The tracing framework can interact with other AWS services, HTTP servers, other methods and queries. Some AWS services that integrate with X-Ray include Amazon EC2 Amazon SNS and API Gateway. The SDK or API keeps track of trace data during these interactions.
AWS services that integrate with X-Ray can add tracing headers to incoming requests, send trace data to X-Ray, or run an agent to collect trace data. For example, AWS Lambda can send trace data about requests to your Lambda functions.
For more information about other services that work with X-Ray see Integrating AWS X-Ray with other AWS services.
-
You can view data in the console about your traces, segments, and subsegments in a graphical user interface (GUI). You can use the following options:
-
The https://console.aws.amazon.com/cloudwatch/
– A GUI experience to view traces, logs and metrics in one location. The legacy X-Ray service maps and legacy CloudWatch ServiceLens map are combined into the X-Ray trace map within the CloudWatch console. -
The https://console.aws.amazon.com/xray/home
– A legacy GUI experience where you can view information about your traces. You can view information that includes insights about your traces, a trace map, a service map, and analytics. AWS is no longer developing this console experience.
-
X-Ray uses trace data from AWS resources that your application interacts with to generate a detailed trace map. The trace map shows the client, your front-end service, and backend services that your front-end service calls in a single request. Use the trace map to identity bottlenecks, latency spikes, and other issues to solve or improve the performance of your applications.
X-Ray will also generate a service map that provides an overall view of how your application interacts with your service nodes. Edges in the service map connect the service nodes. They show how often the nodes communicate with each other and latency for those communications.
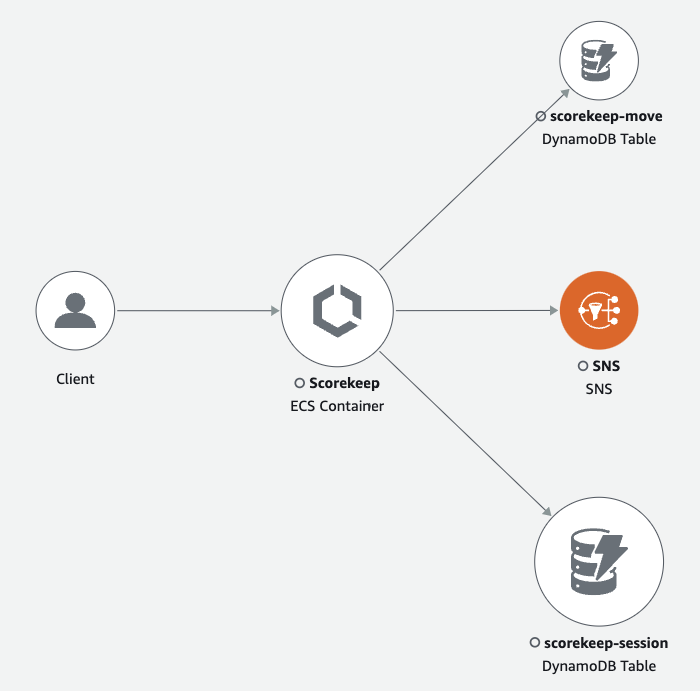
The following image shows an example of a service map, which displays how your application interacts with different components. You can view a service map in the console. The image shows an application receiving a request from a climservice noent. Then, the image shows how the application interacts with two DynamoDB tables and Amazon SNS.
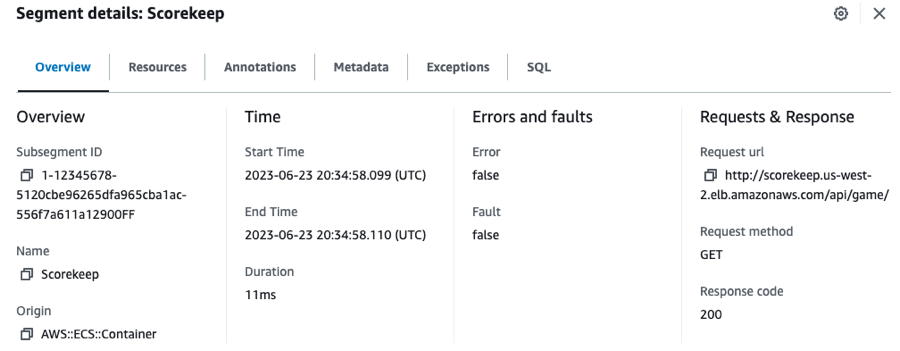
The following image is an example of the data available in the console for a single segment in a trace. The image shows a timeline listing several segments and the starting time and duration that each segment ran in relation to the others. The image also shows the segment status, and the HTTP response code.

Get started with X-Ray
To use X-Ray, you must do the following:
-
Instrument your application, which allows X-Ray to track how your application processes a request.
-
(Optional) Configure X-Ray to work with other AWS services that integrate with X-Ray.
-
Deploy your instrumented application. As your application receives requests, X-Ray will record trace, segment and subsegment data.
-
(Optional) Open a console to view and analyze the data. You can see a GUI representation of a trace map, service map, and more to inspect how your application functions. Use the graphical information information in the console to optimize, debug and understand your application.
The following diagram shows how to get started using X-Ray:

To get started with X-Ray, do the following:
-
Instrument your application – Use the X-Ray SDKs, X-Ray APIs, ADOT or CloudWatch Application Signals to send trace data to X-Ray. For more information, see Instrumenting your application for AWS X-Ray.
-
(Optional) – Set up tracing to work with AWS services that integrate with X-Ray. You can sample traces and add headers to incoming requests, run an agent or collector, and automatically send trace data to X-Ray. For more information, see Integrating AWS X-Ray with other AWS services.
-
Deploy your application. In this step, you might also have to set up an IAM policy and deploy an agent or collector.
-
Analyze trace data in the console. Use the information to understand your workflow, debug issues, and optimize your application.
For an example of the data and maps that are available in the console, launch a sample application that is already instrumented to generate trace data. In a few minutes, you can generate traffic, send segments to X-Ray, and view a trace and service map.
Concepts
AWS X-Ray receives data from services as segments. X-Ray then groups segments that have a common request into traces. X-Ray processes the traces to generate a service graph that provides a visual representation of your application.
Concepts
Segments
The compute resources running your application logic send data about their work as segments. A segment provides the resource's name, details about the request, and details about the work done. For example, when an HTTP request reaches your application, it can record the following data about:
-
The host – hostname, alias or IP address.
-
The request – method, client address, path, user agent.
-
The response – status, content.
-
The work done – start and end times, subsegments.
-
Issues that occur – errors, faults and exceptions, including automatic capture of exception stacks.
The following image is an example overview information returned about a segment. The image shows information about an id, start and end time, any errors or faults, and the request and response code from an HTTP request:
The tracing framework, which consists of SDKs or APIs, gathers information from request and response headers, the code in your application, and metadata about the AWS resources on which your application runs. You choose which data X-Ray collects by modifying your application configuration or code to instrument incoming requests, downstream requests, and AWS services.
Forwarded Requests
If a load balancer or other intermediary forwards a request to your application,
X-Ray takes the client IP from the X-Forwarded-For header in the
request instead of from the source IP in the IP packet. The client IP that is recorded for a forwarded
request can be forged, so it should not be trusted.
You can use a tracing framework such as an SDK or API to record more information including annotations and metadata. For details about segment and subsegment structure and recorded information, see AWS X-Ray segment documents. Segment documents can be up to 64 kB in size.
Subsegments
You can divide a segment into subsegments. Subsegments provide more granular timing information and details about downstream calls that your application makes to serve the original request. A subsegment contains additional details about a call to an AWS service, an external HTTP API, or an SQL database. You can also define subsegments to instrument specific functions or lines of code in your application.
X-Ray uses subsegments to generate inferred segments and downstream nodes on the trace map for services that don't send their own segments, like Amazon DynamoDB. Subsegments let you see all of your downstream dependencies, even if the dependencies don't support tracing, or are external to AWS.
Subsegments represent your application's view of a downstream call as a client. If the downstream service is also instrumented, its segment replaces the inferred segment from the upstream client's subsegment. The node on the service graph uses information from the service's segment, if available. The edge between the two nodes uses the upstream service's subsegment.
For example, when you call DynamoDB with an instrumented AWS SDK client, the X-Ray SDK records a subsegment for that call. DynamoDB doesn't send a segment, so the subsegment contains information about the following:
-
The inferred segment in the trace.
-
The DynamoDB; node on the service graph.
-
The edge between your service and DynamoDB.
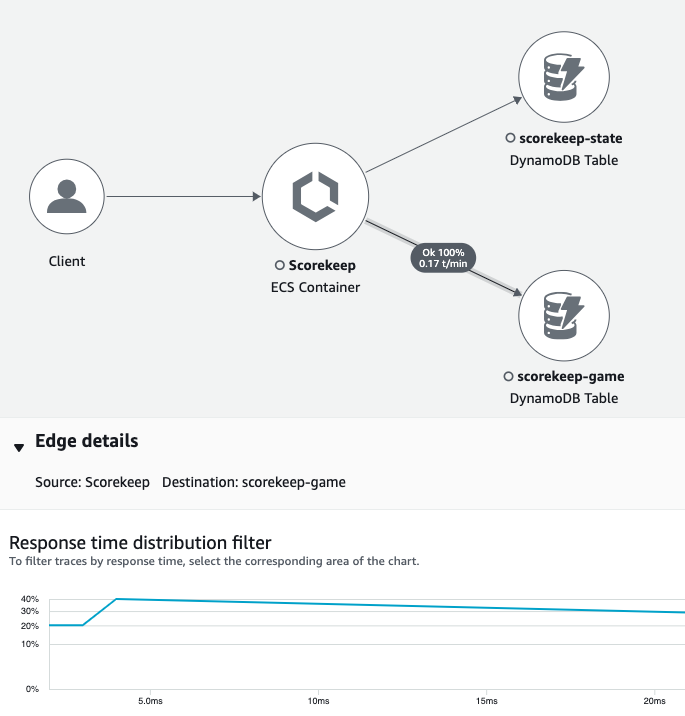
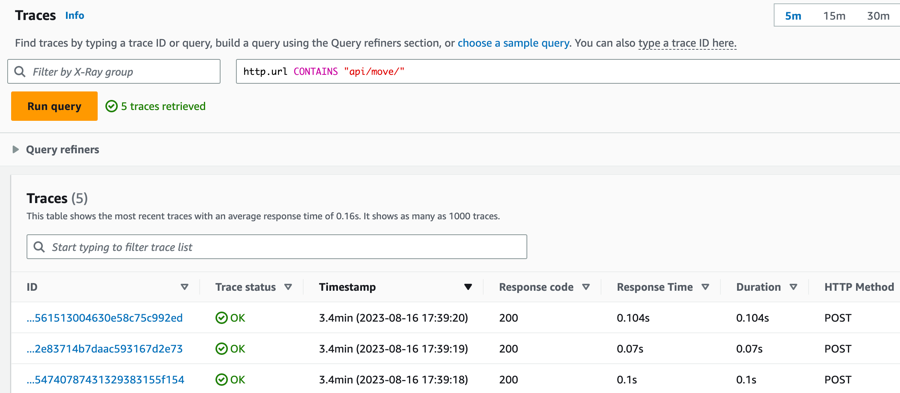
The following diagram shows the service map for a sample application. In the image, the client makes a request to a sample Scorekeep application. The Scorekeep application makes two calls to DynamoDB. An edge in the service map represents each of these calls. Select an edge to see the health status, number, and frequency of calls made to a DynamoDB table. The following image shows traces that correspond to an edge filtered by response time.
When you call another instrumented service with an instrumented application, the downstream service sends its own segment. This segment records its view of the same call that the upstream service recorded in a subsegment. In the service graph, both services' nodes contain timing and error information from their segments. The edge between them contains information from the upstream service's subsegment. The downstream service records when it started and ended work on the request. The upstream service records the round trip latency, including time that the request spent traveling between the two services.
The following image shows trace information filtered by response time from an edge that corresponds to an upstream Lambda function.

Service graph
X-Ray uses the data that your application sends to generate a service graph. Each AWS resource that sends data to X-Ray appears as a service node in the graph. Edges connect the services that work together to serve requests, connect clients to your application, and connect your application to the downstream services and resources that it uses.
Service Names
A segment's name should match the domain name or logical name of the service
that generates the segment. However, this is not enforced. Any application that has permission to
PutTraceSegments can send segments with any name.
A service graph is a JSON document that contains information about the services and resources that make up your application. The X-Ray console uses the service graph to generate a visualization or service map.
The following image shows a service map. The service map displays the relationship between the client's request to your application and the services that your application interacts with to serve the request. In the following image, a sample Scorekeep application interacts with two DynamoDB tables and Amazon SNS.
In a distributed application, X-Ray combines nodes from all services that process requests with the same trace ID into a single service graph. The first service that the request interacts with adds a tracing header that is propagated between the front end and services that it calls.
For example, Scorekeep runs a web API that calls an AWS Lambda function to generate a random name. Then, the X-Ray SDK generates the trace ID and tracks calls to the Lambda function. AWS Lambda passes tracing data and the trace ID to the Lambda function. The X-Ray SDK also uses the same trace ID to send data to an agent or collector. As a result, nodes for the API, the AWS Lambda service, and the Lambda function all appear as separate but connected nodes on the trace map.
Service graph data is retained for 30 days.
Traces
A trace collects all the segments generated by a single request. The trace uses a trace ID to track the path of a request through your application. That request is usually an HTTP GET or POST request that travels through a load balancer, interacts with your application code, and generates downstream calls to other AWS services or external web APIs. The first supported service that the HTTP request interacts with adds a trace ID header to the request. IThe service then and propagates trace ID downstream to track latency, disposition, and other request data.
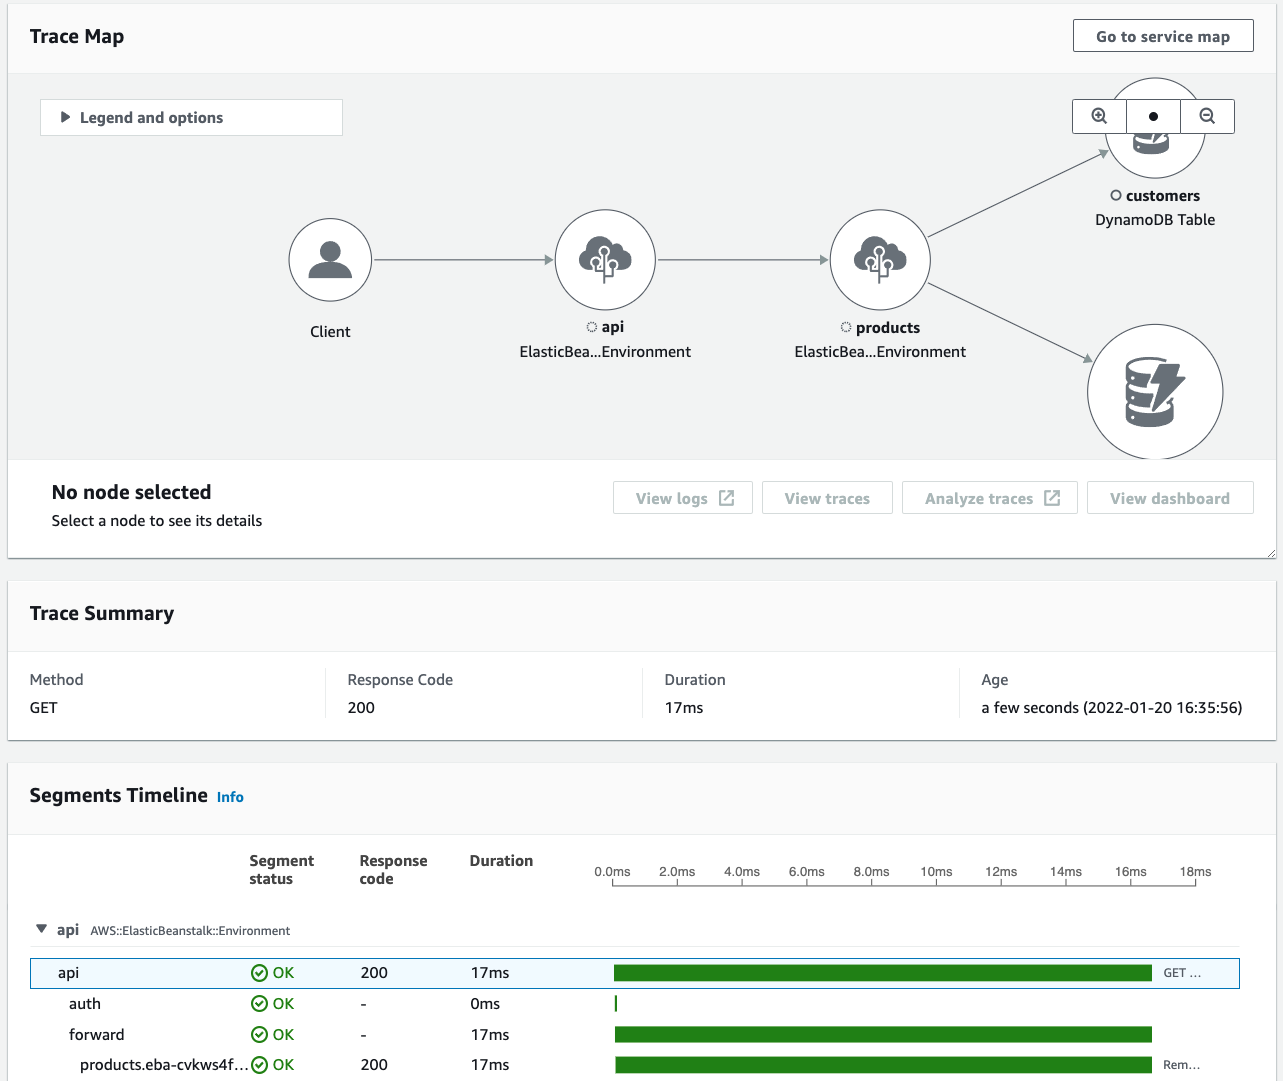
The following image shows an example of an application serving an HTTP request. The trace summary contains the HTTP response code, the time to serve the request, and how long ago the application served the request. The following image also shows a timeline for each trace segment. The timeline shows the status, HTTP response code and time that it took the segment to finish. A chart shows the duration, start and end time of each segment in the trace with respect to the other segments.
For more information about how X-Ray bills trace collection, see AWS X-Ray pricing
Sampling
The X-Ray SDK applies a sampling algorithm to ensure efficient tracing and provide a representative sample of the requests that your application serves. This algorithm determines which requests get traced. By default, the X-Ray SDK records the first request received at the beginning of each second, and five percent of any additional requests.
To avoid incurring service charges when you are getting started, the default sampling rate is conservative. You can configure X-Ray to change the default sampling rate and configure additional rules that apply sampling based on properties of the service or request.
For example, you might want to disable sampling and trace all requests for calls that modify state or handle users or transactions. For high-volume read-only calls, like background polling, health checks, or connection maintenance.
For more information, see Configuring sampling rules.
Tracing header
All requests are traced, up to a minimum number, which you can configure. After reaching
that minimum, X-Ray traces only a percentage of requests to avoid extra costs. X-Ray adds
the sampling decision and trace ID to HTTP requests in tracing
headers that start with X-Amzn-Trace-Id. X-Ray adds these headers
when a request interacts with the first AWS service that integrates with X-Ray. The X-Ray
SDK reads these headers and includes them in the response.
Example Tracing header with root trace ID and sampling decision
X-Amzn-Trace-Id: Root=1-5759e988-bd862e3fe1be46a994272793;Sampled=1Tracing Header Security
A tracing header can originate from the X-Ray SDK, an AWS service, or the client
request. Your application can remove X-Amzn-Trace-Id from incoming requests to
avoid issues caused by users adding trace IDs or sampling decisions to their
requests.
The tracing header can also contain a parent segment ID if the request originated from an instrumented application. For example, if your application calls a downstream HTTP web API with an instrumented HTTP client, the X-Ray SDK adds the segment ID for the original request to the tracing header of the downstream request. An instrumented application that serves the downstream request uses the parent segment ID to connect the two requests.
Example Tracing header with root trace ID, parent segment ID and sampling decision
X-Amzn-Trace-Id: Root=1-5759e988-bd862e3fe1be46a994272793;Parent=53995c3f42cd8ad8;Sampled=1Lambda or other AWS services might append part of a header that starts with
Lineage as part of their processing mechanisms. You should not directly use the
appended part of the trace header.
Example Tracing header with Lineage
X-Amzn-Trace-Id: Root=1-5759e988-bd862e3fe1be46a994272793;Sampled=1;Lineage=a87bd80c:1|68fd508a:5|c512fbe3:2Filter expressions
Even if sample a small subset of data, a complex application can generate a lot of trace data. Use filter expressions to be able to find specific traces including those for individual requests, specific paths or users.
The following image shows a text box in the X-Ray console that you can use to filter by a group that you define. For more information about groups, see the following section Groups.
Groups
You can use a group inside a filter expression to reduce the amount of trace data and focus on data that fit the group criteria.
Use a group to generate service graphs, trace summaries and CloudWatch metrics that are specific to that group. You can call by name or by Amazon Resource Name (ARN). X-Ray checks incoming traces against the group filter expression as they are stored in the X-Ray service. CloudWatch publishes metrics for traces that match the group criteria every minute.
Updating a group's filter expression doesn't change data that's already recorded. The update applies only to subsequent traces. This can result in a merged graph of the new and old expressions. To avoid merging unconnected groups inside a single graph, delete the current group and create a new one.
Note
The billing for groups is based on the number of retrieved traces that match the filter
expression. For more information, see AWS X-Ray
pricing
For more information about groups, see Configuring groups.
Annotations and metadata
When you instrument your application, the X-Ray SDK records information about incoming and outgoing requests. The SDK also records information about the AWS resources used, and the application itself. You can add other information to the segment document as annotations and metadata. Annotations and metadata are combined at the trace level. They can be added to any segment or subsegment.
Annotations are key-value pairs that are indexed
for use with filter expressions. Use annotations
to record data that you want to use to group traces in the console, or when calling the
GetTraceSummaries API.
X-Ray indexes up to 50 annotations per trace.
Metadata are key-value pairs with values of any type, including objects and lists, that are not indexed. Use metadata to record data you want to store in the trace but don't need to use for searching traces.
You can view annotations and metadata in the segment or subsegment details window, within the Trace details page in the CloudWatch console.
Errors, faults, and exceptions
X-Ray tracks errors in your application code and those returned by downstream services.X-Ray tracks the following HTTP response codes from requests:
-
Error– Client errors (400 series errors) indicate that the server could not understand or process the request from the client because the request itself contained an error. These errors can be caused by syntax errors, missing information or a bad request body. -
Fault– Server faults (500 series errors) indicate that the server could not process a valid request because of an issue with the server itself. These errors can be caused by issues that include failures in software or hardware, or resource limitations of the server. -
Throttle– Throttling errors (429 Too Many Requests) are a specific type of client error that occurs when a client sends too many requests to a server or API over a period of time.
If an exception occurs while your application is serving an instrumented request, the X-Ray SDK records details about the exception, including the stack trace id, if available. You can view exceptions under segment details in the X-Ray console.
