Track usage and costs with the Deadline Cloud usage explorer
With the Deadline Cloud usage explorer, you can see real-time metrics on the activity happening on each farm. You can look at the farm’s costs by different variables, such as queue, fleet, job, license product, or instance types. Select various time frames to see usage during a specific period of time, and look at usage trends over the course of time. You can also see a detailed breakdown of selected data points, allowing for a closer look into metrics. Usage can be shown by time (minutes and hours) or by cost ($USD).
The following sections show you the steps for accessing and using the Deadline Cloud usage explorer.
Prerequisite
To use the Deadline Cloud usage explorer, you must have either MANAGER or
OWNER farm permissions. For more information, see Understanding access levels.
Note
If your time zone doesn't align to a full hour, such as India Standard Time (UTC+5:30), the usage explorer doesn't show usage metrics. To see metrics, set your time zone to a zone that aligns to a full hour.
Open the usage explorer
To open the Deadline Cloud usage explorer, use the following procedure.
-
Sign in to the AWS Management Console and open the Deadline Cloud console
. -
To see all available farms, choose View farms.
-
Locate the farm that you want to get information about, then choose Manage jobs. The Deadline Cloud monitor opens in a new tab.
-
In the Deadline Cloud monitor, from the left menu, select Usage explorer.
Use the usage explorer
From the usage explorer page, you can select specific parameters in which the data can be displayed. By default, you see total usage in time (hours and minutes) within the last 7 days. You can change these parameters, and the information displayed changes dynamically in accordance to the parameter settings.
You can group the results based on the queue, fleet, job, user, compute usage, instance type, or license product. If you choose license product, costs are calculated for specific licenses. For all other groups the time is calculated by adding up the time taken for each task to run.
You can filter results by queues or by fleets, but you cannot filter by both at the same time.
The usage explorer returns only 100 results based on the filter criteria that you set. The results are listed in descending order by the date created timestamp. If there are more than 100 results, you get an error message. You can refine your query to reduce the number of results:
-
Select a smaller time range
-
Select fewer queues or fleets
-
Select a different grouping, such as grouping by queue or fleet instead of job
Topics
Use visual graphs to review data
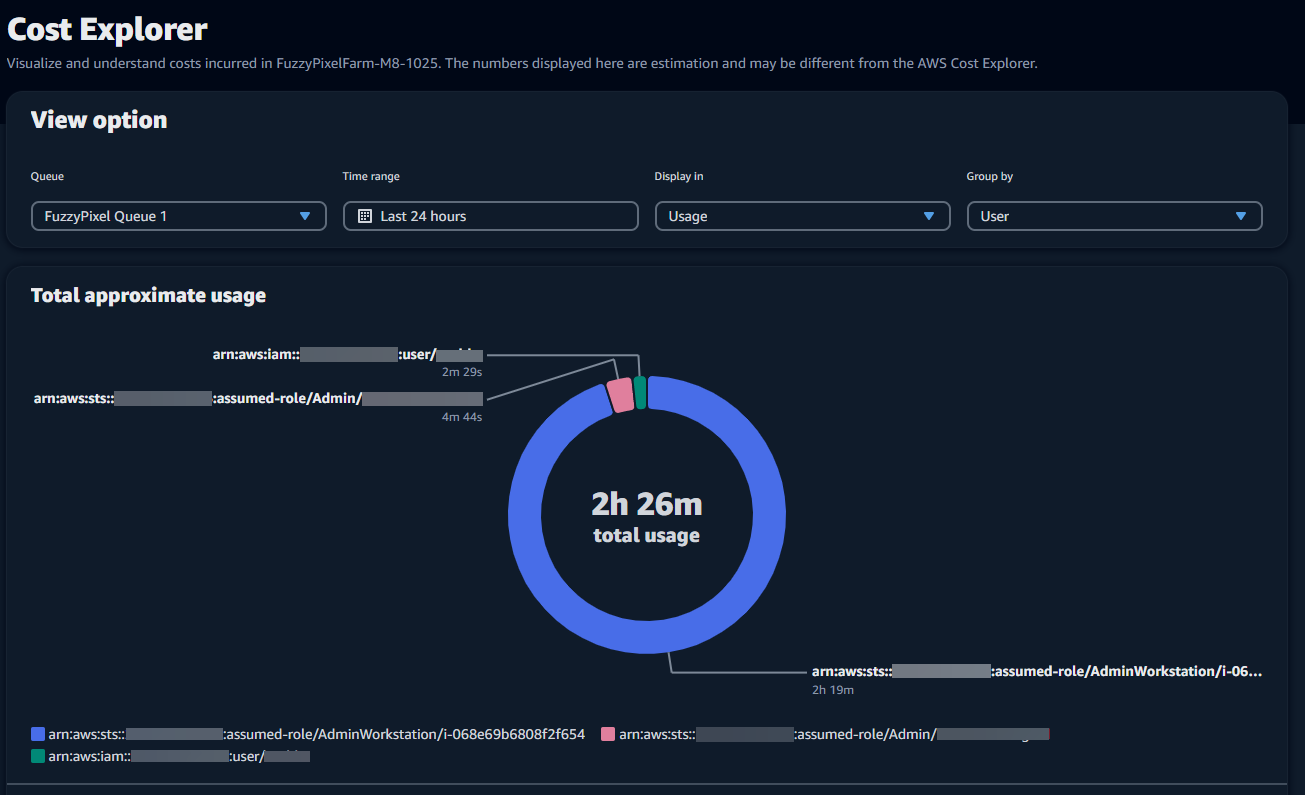
You can review data in a visual format to identify trends and potential areas that might need more analysis or attention. Usage explorer offers a pie chart that displays overall usage and cost with the option to group the totals into smaller subtotals.
Note
The chart only displays the top five results with other results combined in an "others" section. You can view all results in the breakdown section below the chart.
View a breakdown of metrics
Beneath the pie chart, usage explorer offers a more detailed breakdown of specific metrics, which will change as parameters change. By default, five results display in the usage explorer. You can scroll through results using the pagination arrows in the breakdown section.
Breakdown is minimized by default. To expand and display the results, select the View all breakdown arrow. To download the breakdown, choose Download data.
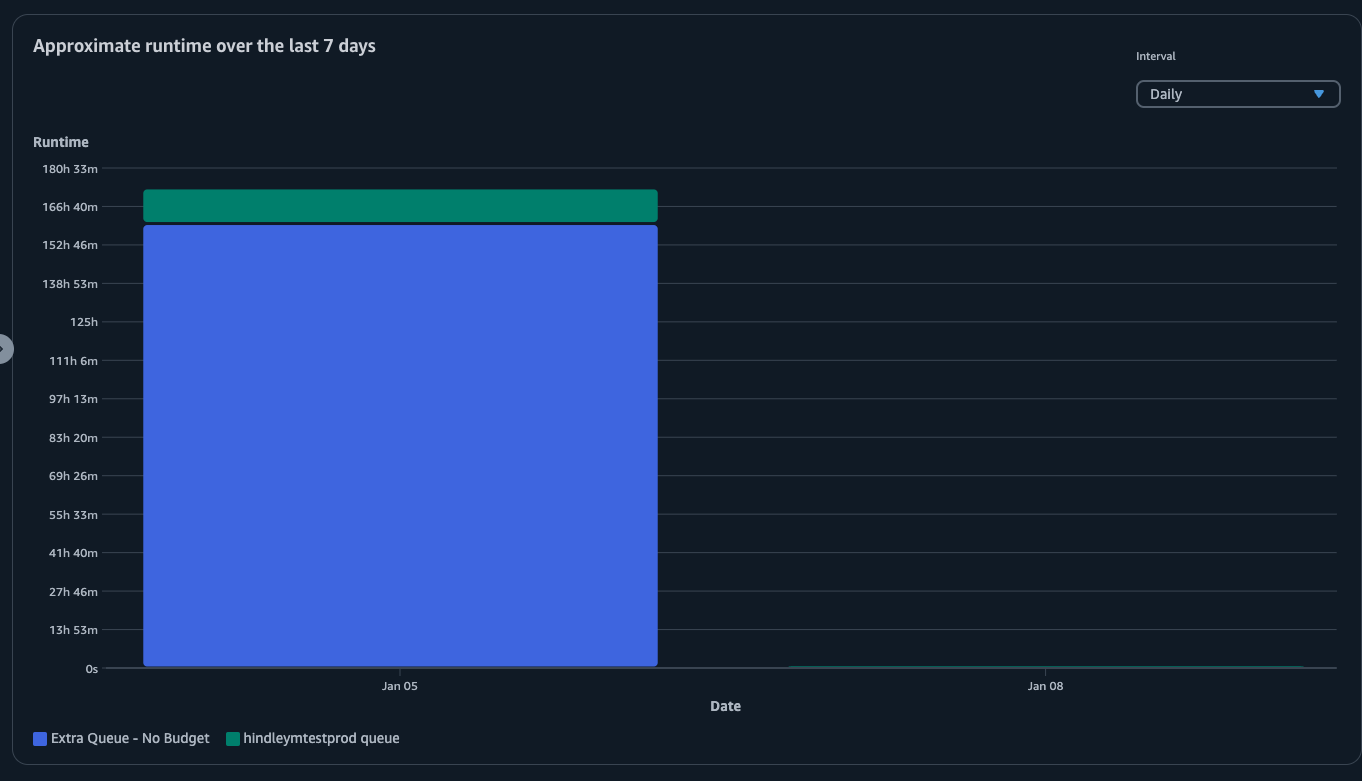
View approximate runtime of queues and fleets
You can also view the approximate runtime of your queues or fleets based on different intervals that you specify. The interval options are hourly, daily, weekly, and monthly. After you select an interval, the graph displays the approximate runtime of your queues or fleets.