Use the Flink UI to monitor Flink jobs
To monitor the health and performance of a running Flink application, use the Flink Web Dashboard. This dashboard provides information about the status of the job, the number of TaskManagers, and the metrics and logs for the job. It also lets you view and modify the configuration of the Flink job, and to interact with the Flink cluster to submit or cancel jobs.
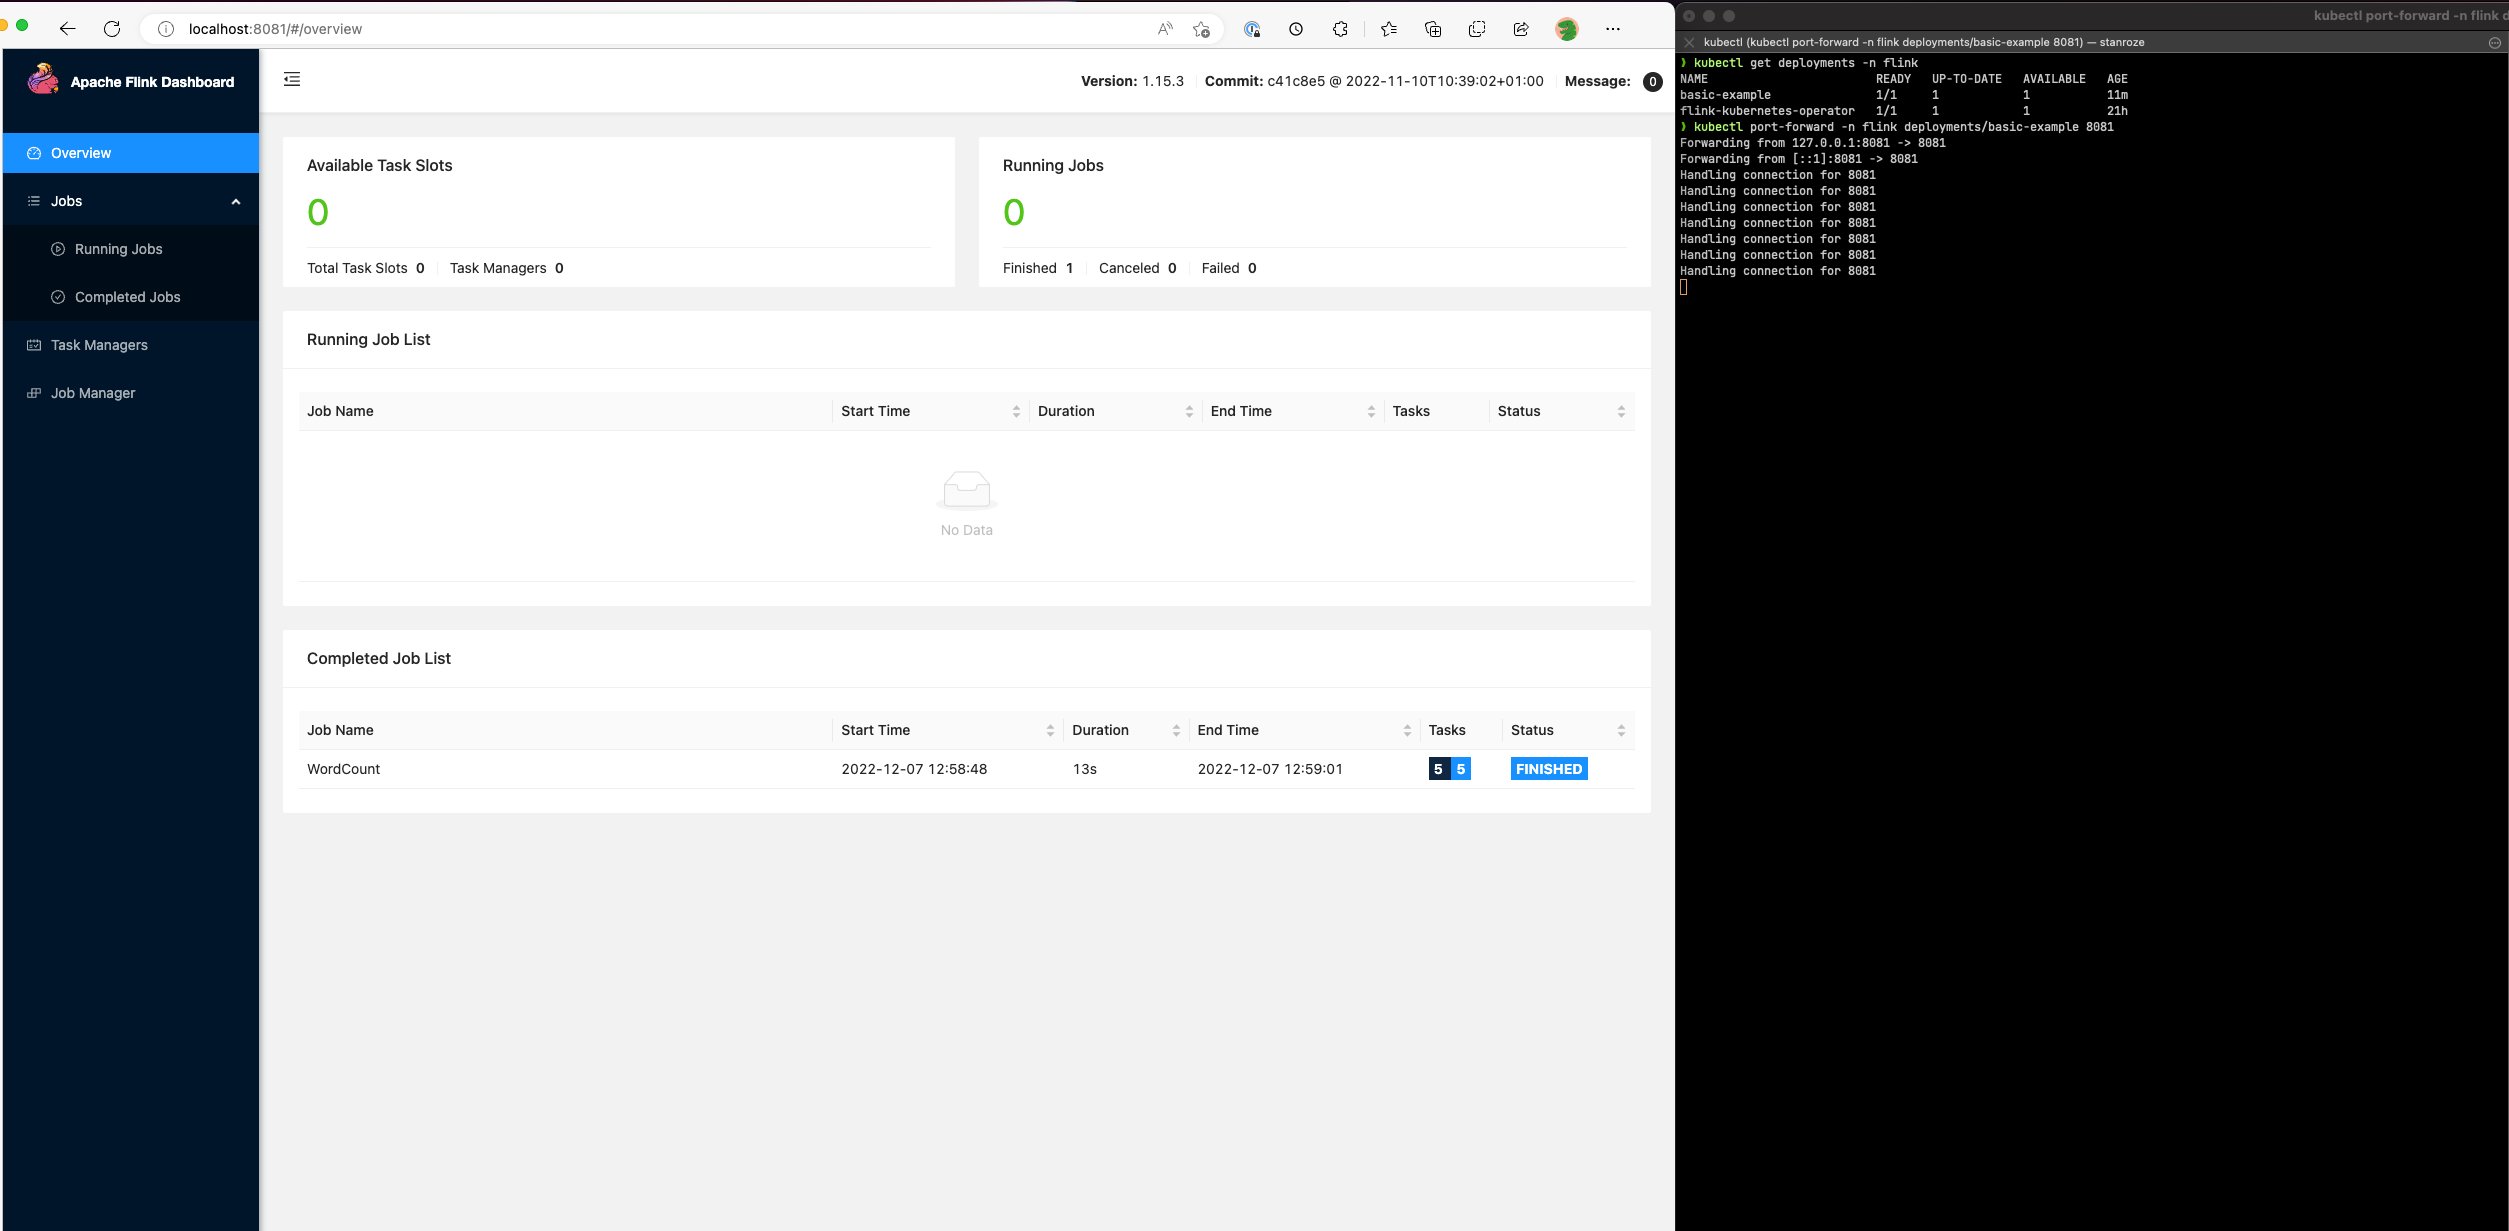
To access the Flink Web Dashboard for a running Flink application on Kubernetes:
Use the
kubectl port-forwardcommand to forward a local port to the port on which the Flink Web Dashboard is running in the Flink application's TaskManager pods. By default, this port is 8081. Replacedeployment-namewith the name of the Flink application deployment from above.kubectl get deployments -nnamespaceExample output:
kubectl get deployments -n flink-namespace
NAME                        READY   UP-TO-DATE   AVAILABLE  AGE
basic-example               1/1       1            1           11m
flink-kubernetes-operator   1/1       1            1           21h
kubectl port-forward deployments/deployment-name8081 -nnamespaceIf you want to use a different port locally, use the
local-port:8081 parameter.kubectl port-forward -n flink deployments/basic-example8080:8081In a web browser, navigate to
http://localhost:8081(orhttp://localhost:if you used a custom local port) to access the Flink Web Dashboard. This dashboard shows information about the running Flink application, such as the status of the job, the number of TaskManagers, and the metrics and logs for the job.local-port