Understanding the heap summary
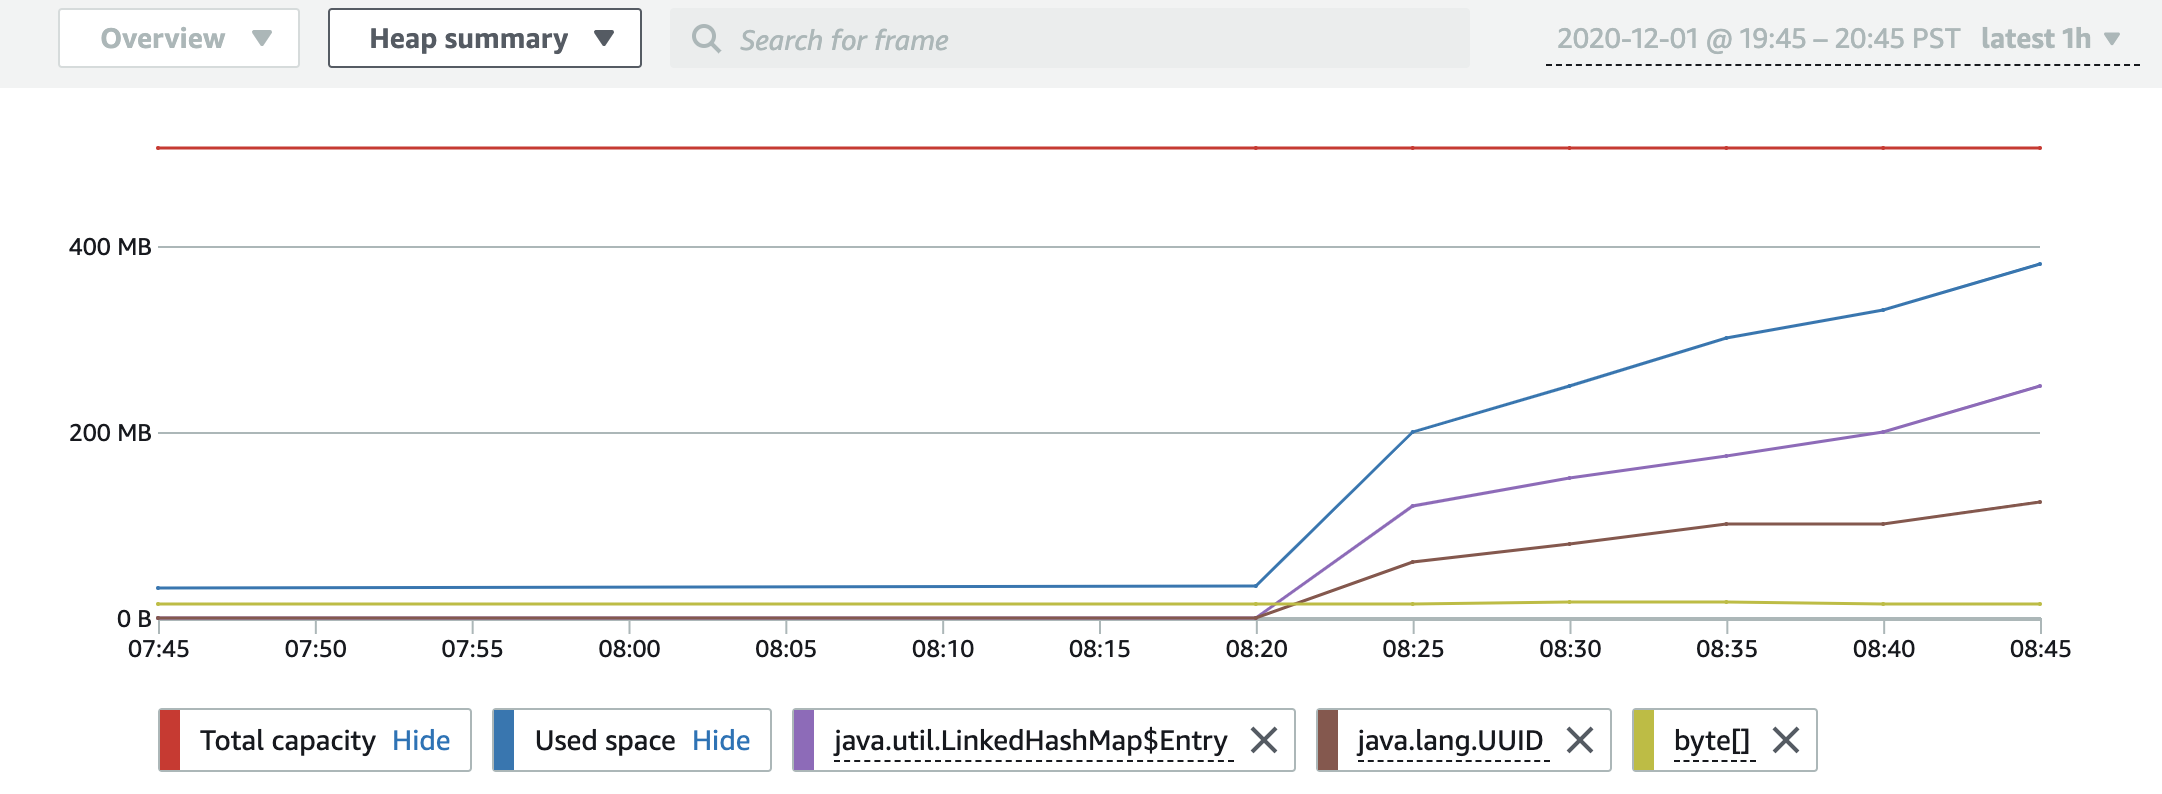
The Heap summary visualization shows your application’s heap usage over time. You can change the time period shown using the time range selector in the top-right. For information on enabling the heap summary data collection feature, see Step 4: Start CodeGuru Profiler in your application.
To view your application's heap summary visualization, select your profiling group in the CodeGuru Profiler console
Total capacity
This shows the maximum heap size configured for the JVM. If your application’s used space reaches this value then you may run out of memory. This value is equal to your JVM’s Xmx value (if configured).
Used space
This shows how much heap space your application requires to store all objects required in memory after a garbage collection cycle. If this value continuously grows over time until it reaches total capacity, then that could be an indication of a memory leak. If this value is very low compared to total capacity, then you may be able to save money by reducing your system’s memory.
Heap summary table
The Heap summary table shows information about the object types consuming the most heap space in your application. The size of each type only accounts for the shallow memory requirement of that type, and does not include the size of objects referenced by objects of that type. Values are averaged across all hosts reporting data at the same time.
Only object types that consume more than 0.5% (by default) of your heap’s total capacity across all objects are detected. Object types with consumption below that threshold are counted as part of the used capacity value, and are not shown individually in the table.
Object types that are below that threshold for at least one data point are shown with an Incomplete data badge. The values shown are only averages of the data available, and do not include time periods during which the object type size was lower than the 0.5% capacity threshold.
Object types
-
The Average usage by type shows how much heap space your application requires to store all objects required in memory after a garbage collection cycle. If this value continuously grows over time until it reaches total capacity, it could indicate a memory leak. If this value is very low compared to total capacity, then you may be able to save money by reducing your system’s memory.
-
The Average number of objects indicates the average number of objects of this type on the heap during the time period.
-
Use the my code namespace (if configured) to categorize the type into one of several categories. The my code namespace can be configured in the Actions dropdown list at the top of the page. The table of object types can be filtered based on this code type.
