Accessing file system metrics
You can see Amazon FSx metrics for CloudWatch in the following ways.
The Amazon FSx console
The CloudWatch console
The CloudWatch CLI
The CloudWatch API
The following procedures describe how to access your file system's metrics using these various tools.
To view file system metrics using the Amazon FSx console
-
Open the Amazon FSx console at https://console.aws.amazon.com/fsx/
. -
To display the File system details page, choose File systems in the navigation pane.
Choose the file system whose metrics you want to view.
-
To view graphs of the file system's metrics, choose Monitoring & performance on the second panel.
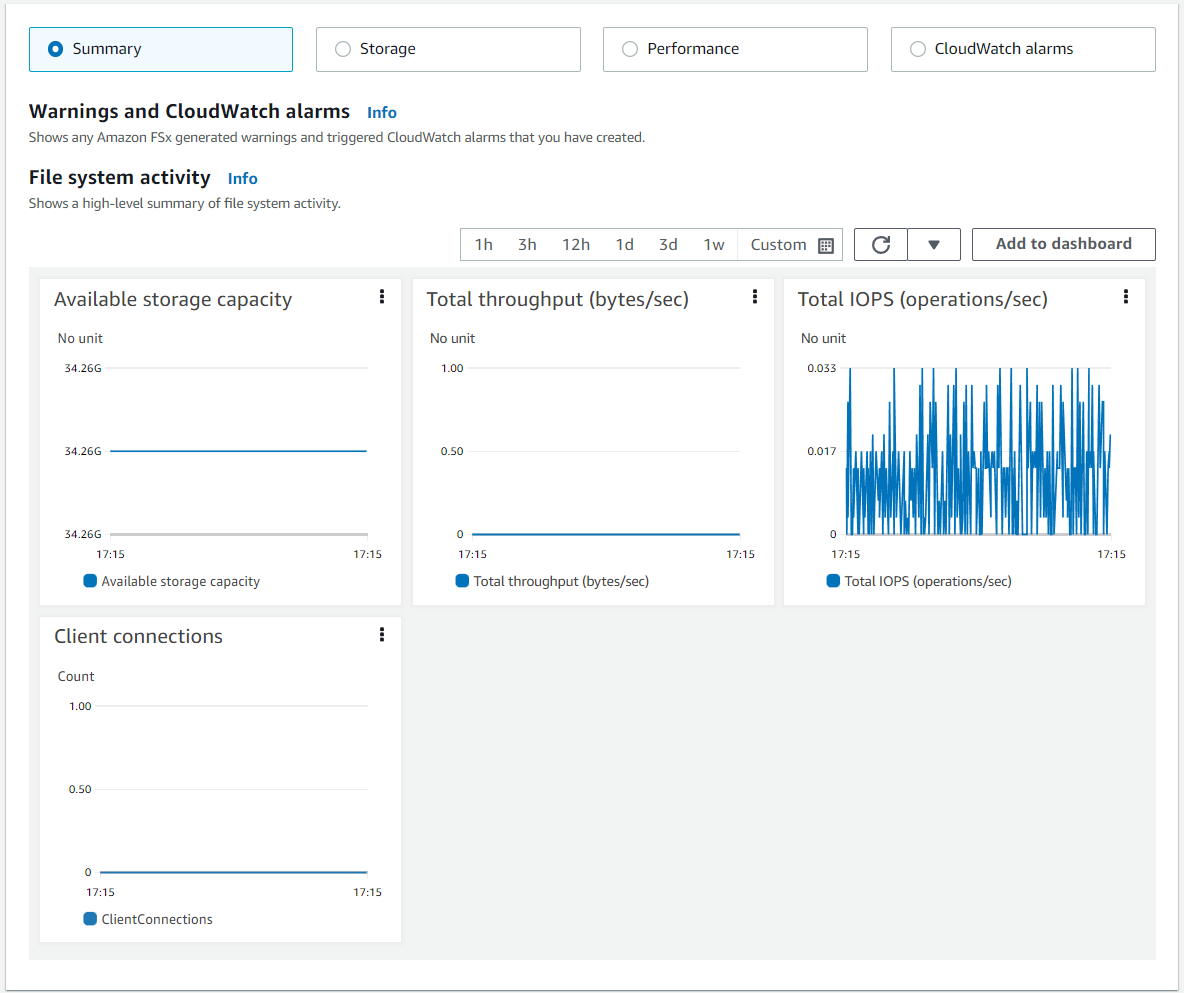
The Summary metrics are displayed by default, showing any active warnings and CloudWatch alarms along with File system activity metrics.
Choose Storage to view storage capacity and utilization metrics.
Choose Performance to view file server and storage performance metrics
Choose CloudWatch alarms to view graphs of any alarms configured for the file system.
For more information, see Using file system metrics
To view metrics in the CloudWatch console
-
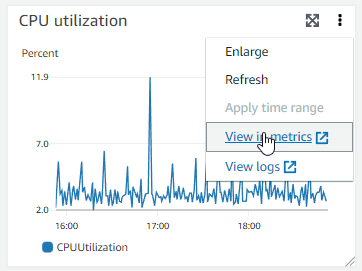
To view a file system metric in the Metrics page of the Amazon CloudWatch console, navigate to the metric in the Monitoring & performance panel of the Amazon FSx console.
-
Choose View in metrics from the actions menu in the upper right of the metric graph, as shown in the following image.
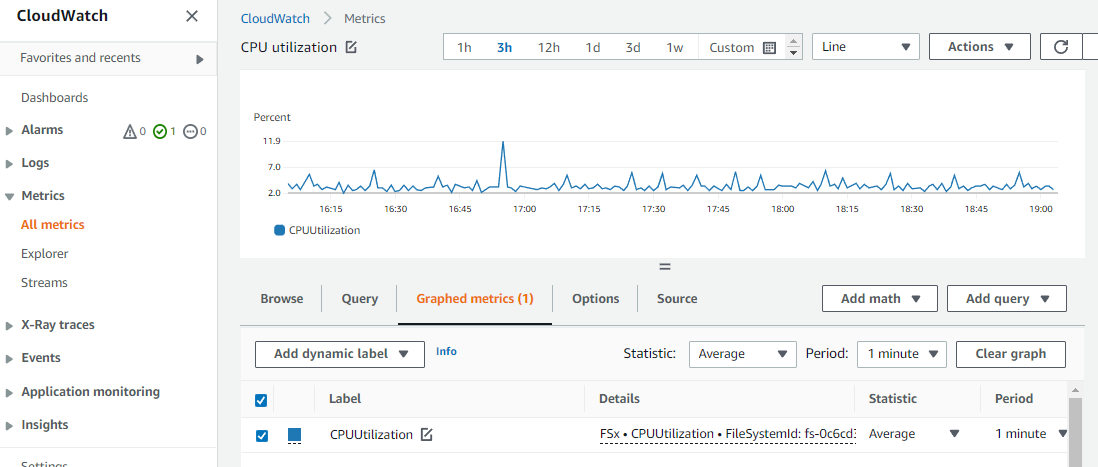
This opens the Metrics page in the CloudWatch console, showing the metric graph, as shown in the following image.
To add metrics to a CloudWatch dashboard
-
To add a set of FSx for Windows file system metrics to a dashboard in the CloudWatch console, choose the set of metrics (Summary, Storage, or Performance) in the Monitoring & performance panel of the Amazon FSx console.
-
Choose Add to dashboard in the upper right of the panel, this opens the CloudWatch console.
-
Select an existing CloudWatch dashboard from the list, or create a new dashboard. For more information, see Using Amazon CloudWatch dashboards in the Amazon CloudWatch User Guide.
To access metrics from the AWS CLI
-
Use the
list-metricscommand with the--namespace "AWS/FSx"namespace. For more information, see the AWS CLI Command Reference.$aws cloudwatch list-metrics --namespace "AWS/FSx"aws cloudwatch list-metrics --namespace "AWS/FSx" { "Metrics": [ { "Namespace": "AWS/FSx", "MetricName": "DataWriteOperationTime", "Dimensions": [ { "Name": "FileSystemId", "Value": "fs-09a106ebc3a0bb087" } ] }, { "Namespace": "AWS/FSx", "MetricName": "CapacityPoolWriteBytes", "Dimensions": [ { "Name": "VolumeId", "Value": "fsvol-0cb2281509f5db3c2" }, { "Name": "FileSystemId", "Value": "fs-09a106ebc3a0bb087" } ] }, { "Namespace": "AWS/FSx", "MetricName": "DiskReadBytes", "Dimensions": [ { "Name": "FileSystemId", "Value": "fs-09a106ebc3a0bb087" } ] }, { "Namespace": "AWS/FSx", "MetricName": "CompressionRatio", "Dimensions": [ { "Name": "FileSystemId", "Value": "fs-0f84c9a176a4d7c92" } ] }, . . . }
Using the CloudWatch API
To access metrics from the CloudWatch API
-
Call
GetMetricStatistics. For more information, see Amazon CloudWatch API Reference.
