AWS Systems Manager Incident Manager is no longer open to new customers. Existing customers can continue to use the service as normal. For more information, see AWS Systems Manager Incident Manager availability change.
Viewing incident details in the Incident Manager console
AWS Systems Manager Incident Manager tracks your incidents from the moment they're detected to resolution and through post-incident analysis. You can find all incidents on the Incident list page in the Incident Manager console, with links directly to the Incident details.
Viewing the incident list in the console
The Incident list page contains three sections: Open incidents, Resolved incidents, and Analyses. You can manually track new incidents and create analyses from this page. To learn more about manually tracking an incident, see Creating incidents manually in the Incident creation section of this guide. To learn about post-incident analysis, see the Performing a post-incident analysis in Incident Manager section of this guide.
The Incident details displays Open incidents in tiles with the title, impact, duration, and chat channel for that incident. After you resolve an incident, it moves to the Resolved incidents list. Analyses are in the second tab.
Viewing incident details in the console
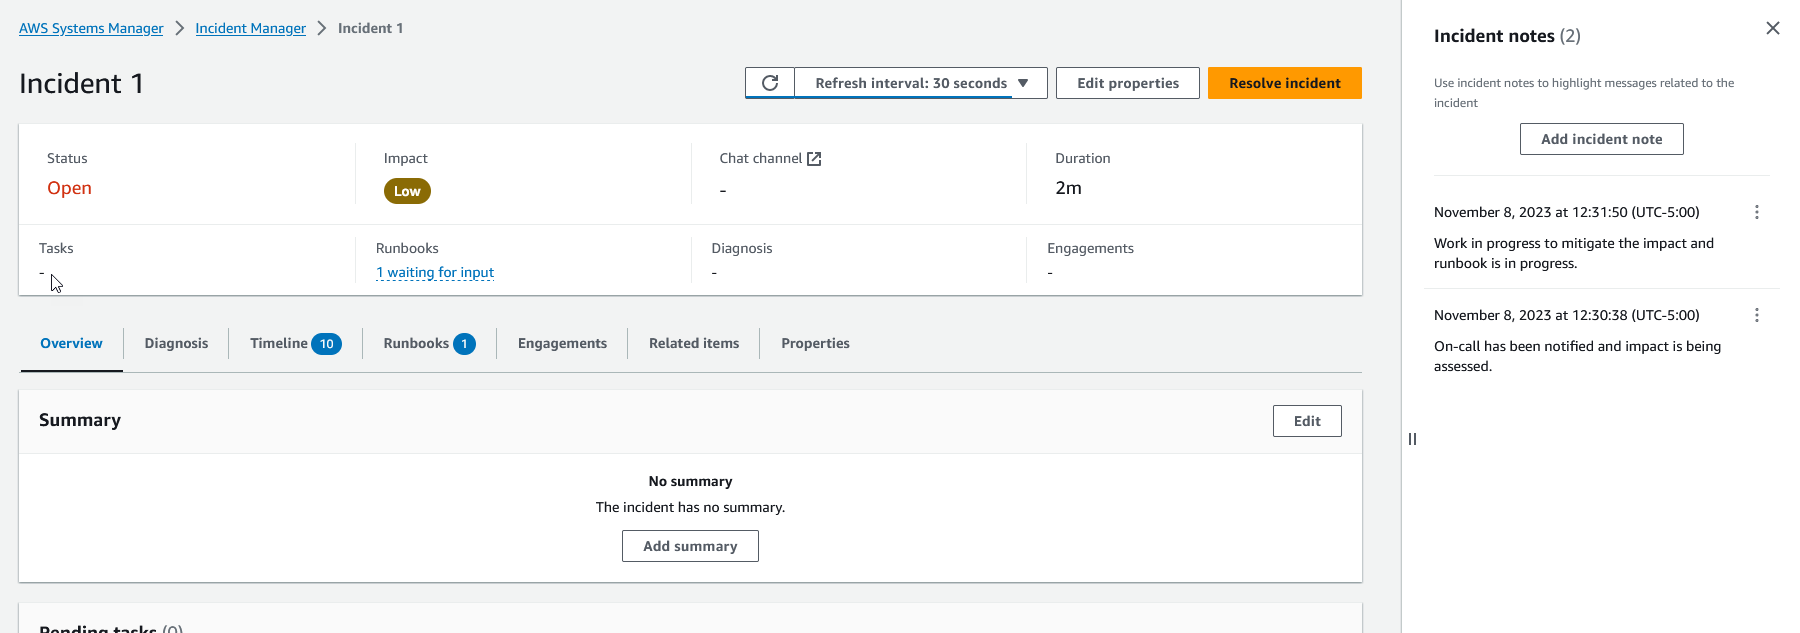
The Incident details page provides detailed insights and tools you can use to manage an incident. From this page, you can start runbooks to mitigate an incident, add incident notes, engage other resolvers, and view incident details such as timelines, metrics, properties, and related resources.
As shown in the following image, the Incident details page includes several sections: Top banner, Incident notes, and seven tabs that contain additional information and resources. By default, the Top banner and Incident notes sections are displayed on all Incident details pages.
This topic explains elements of the Incident details page and actions that you can perform from the page.
Top banner
The top banner on every incident details page includes the following information:
-
Status – The current status of an incident can be Open or Resolved.
-
Impact – The impact of the incident on your environment. It can be high, medium, and low. To change the impact of an incident, choose Edit properties.
-
Chat channel – A link to access the chat channel where you can view incident updates and notifications.
-
Duration – The amount of time lapsed before a responder resolves the incident.
-
Runbooks – The statuses for the runbooks associated with this incident. The status can be waiting for input, successful, or unsuccessful. If a runbook’s status is waiting for input, you can select the runbook to view action details. You can select unsuccessful to view runbooks that are Timed out, Failed, or Canceled.
-
Engagements – The total number of engagements and the status of each engagement. When you create an engagement, its status is Engaged. Once you acknowledge the engagement, the status changes from Engaged to Acknowledged. Incident Manager doesn’t support acknowledgement of third-party engagements. Such engagements remain in the Engaged status.
You can edit the incident title, impact, and chat channel by choosing Edit in the top-right corner of the banner.
Incident notes
The right side of the screen displays the Incident notes section. With notes, you can collaborate and communicate with other users that work on an incident. You can explain the mitigations that you applied, a potential root cause you identified, or the current status of the incident. As a best practice, use the Incident notes section to post status updates and actions you or others take on an incident. If you need to communicate with other resolvers in real time, use the chat channel available in Incident Manager.
To add a note, choose the Add incident note button, and then enter your note. Notes can contain updates about incident status or any other relevant information that provides visibility to other users. If required, you can also edit or delete incident notes.
Note
Any user with IAM permission to run the
ssm-incidents:UpdateTimelineEvent and
ssm-incidents:DeleteTimelineEvent actions can edit and delete
notes. However, when you share an incident with another account, the resource
policy doesn’t include the ssm-incidents:DeleteTimelineEvent
action. This prevents the user that you share the incident with from deleting
the note. You can view the audit trail for a note from Incident Manager events in the
AWS CloudTrail console.
Tabs
The incident details page has seven tabs, making it easier for responders to locate and view information during an incident. The tabs display a counter in the tab name, which indicates the number of updates to the tab. For more information about the contents of each tab as well as available actions, continue reading.
Overview
The Overview tab is the landing page for responders. It contains the incident summary, a list of recent timeline events, and the current runbook step.
Responders use the Summary to catch up on what actions have been taken, the results of any changes, possible next steps, and information about the impact of the incident. To update the summary, choose Edit in the top-right corner of the Summary section.
Important
If multiple responders are editing the summary field simultaneously, the responder who submits their edits last overwrites all other input.
The Recent timeline events section contains a timeline populated by Incident Manager with the five most recent events. Use this section to understand the status of the incident and what has recently occurred. To view a complete timeline, continue to the Timeline tab.
The overview page also displays the Current runbook step. This step might be an automatic step running in your AWS environment, or it may be a set of manual instructions for responders. To view the complete runbook, including prior and upcoming steps, choose the Runbook tab.
Diagnosis
The Diagnosis tab contains vital information about your AWS hosted applications and systems, including information about metrics and, if enabled, findings.
Working with metrics
Incident Manager uses Amazon CloudWatch to populate the metrics and alarm graphs found on this tab. To learn more about incident management best practices for defining alarms and metrics, see Monitoring in the Incident planning section of this user guide.
To add metrics
-
Choose Add in the upper-right corner of this tab.
-
To add a metric from an existing CloudWatch dashboard, choose From existing CloudWatch dashboard.
-
Choose a Dashboard. This adds all metrics and alarms that are part of the chosen dashboard.
-
(Optional) You can also Select metrics from the dashboard to view specific metrics.
-
-
Add a single metric by selecting From CloudWatch and pasting a metric source. To copy a metric source:
Open the CloudWatch console at https://console.aws.amazon.com/cloudwatch/
. -
In the navigation pane, choose Metrics.
-
On the All metrics tab, enter a search term in the search field, such as a metric name or resource name, and choose Enter.
For example, if you search for the
CPUUtilizationmetric, you will see the namespaces and dimensions associated with this metric. -
Choose one of the results from your search to view the metrics.
-
Choose the Source tab and copy the source.
-
Metric alarm graphs can only be added to the incident details through the related response plan, or by selecting From existing CloudWatch dashboard when adding a metric.
To remove metrics, choose Remove, and then choose the metrics you want to remove from the provided Metrics dropdown.
Viewing findings from AWS CodeDeploy and CloudFormation
After Findings is enabled and all required permissions configured, any findings that might be related to a specific incident are attached to the incident. Responders can view information about these findings on the Incident details page.
To view findings from CodeDeploy and CloudFormation
-
Open the Incident Manager console
. -
Choose the name of an incident to investigate.
-
On the Diagnosis tab, in the Findings area, compare the start times of any reported finding with the start time of the incident.
-
To view more details about a finding, in the Reference column, choose the link to the CodeDeploy or CloudFormation finding.
Timeline
Use the Timeline tab to track events that occur during an incident. Incident Manager automatically populates timeline events that identify significant occurrences during the incident. Responders can add custom events based on occurrences that are detected manually. During the post-incident analysis, the timeline tab provides valuable insights into how to better prepare and respond to incidents in the future. For more information about post-incident analysis, see Performing a post-incident analysis in Incident Manager.
To add a custom timeline event, choose Add. Select a date using the calendar, and then enter a time. All times are shown in your local time zone. Provide a brief description of the event that appears in the timeline.
To edit an existing custom event, select the event on the timeline and choose Edit. You can change the time, date, and description of custom events. You can only edit custom events.
Runbooks
The Runbooks tab of the incident details page is where responders can view runbook steps and start new runbooks.
To start a new runbook, choose Start runbook in the Runbooks section. Use the search field to find the runbook you want to start. Provide any required Parameters and the Version of the runbook you want to use when starting the runbook. Runbooks started during an incident from the Runbooks tab use the permissions of the currently signed-in account.
To navigate to a runbook definition in Systems Manager, choose the runbook's title under Runbooks. To navigate to the running instance of the runbook in Systems Manager, choose the execution details under Execution details. These pages display the template used to start the runbook and the specific details of the currently running instance of the automation document.
The Runbook steps section displays the list of steps that the selected runbook automatically takes or responders manually perform. The steps expand as they become the current step, displaying information required to complete the step, or details about what the step does. Automatic runbook steps resolve after the automation is complete. Manual steps require the responders to choose Next step at the bottom of each step. After a step is complete, the step output appears as a dropdown.
To cancel a runbook execution, choose Cancel runbook. This will stop the execution of the runbook and not complete any further steps in the runbook.
Engagements
The Engagements tab of the incident details drives the engagement of responders and teams. From this tab, you can see who has been engaged, who has responded, as well as which responders are going to be engaged as part of an escalation plan. Responders can engage other contacts directly from this tab. To learn more about creating contacts and escalation plans, see the Creating and configuring contacts in Incident Manager and Creating an escalation plan for responder engagement in Incident Manager sections of this guide.
You can configure response plans with contacts and escalation plans to automatically start engagement at the beginning of an incident. To learn more about configuring response plans, see the Creating and configuring response plans in Incident Manager section of this guide.
You can find information about each contact in the table. This table includes the following information:
-
Name – Links to the contact details page that displays their contact methods and engagement plan.
-
Escalation plan – Links to the escalation plan that engaged the contact.
-
Contact source – Identifies the service that engaged this contact, such as AWS Systems Manager or PagerDuty.
-
Engaged – Displays when the plan engaged a contact, or when to engage a contact as part of an escalation plan.
-
Acknowledged – Displays whether the contact acknowledged the engagement.
To acknowledge an engagement, the responder can do one of the following:
-
Phone call – Enter
1when prompted. -
SMS – Reply to the message with the provided code, or enter the provided code on the Engagements tab of the incident.
-
Email – Enter the provided code on the Engagements tab of the incident.
Related items
The Related items tab is used to collect resources related to incident mitigation. These resources can be ARNs, links to external resources, or files uploaded to Amazon S3 buckets. The table displays a descriptive title and either an ARN, a link, or bucket details. Before using S3 buckets, review Security Best Practices for Amazon S3 in the Amazon S3 User Guide.
When uploading files to an Amazon S3 bucket, versioning is either enabled or suspended on that bucket. When versioning is enabled on the bucket, files uploaded with the same name as an existing file are added as a new version of the file. If versioning is suspended, files uploaded with the same name as an existing file overwrite the existing file. To learn more about versioning, see Using versioning in S3 buckets in the Amazon S3 User Guide.
When removing a file-related item, the file is removed from the incident but is not removed from the Amazon S3 bucket. To learn more about removing objects from an Amazon S3 bucket, see Deleting Amazon S3 objects in the Amazon S3 User Guide.
Properties
The Properties tab provides the following details about the incident.
In the Incident properties section, you can view the following:
-
Status – Describes the current status of the incident. The incident can be Open or Resolved.
-
Start time – The time when the incident was created in Incident Manager.
-
Resolved time – The time that the incident was resolved in Incident Manager.
-
Amazon Resource Name (ARN) – The ARN of the incident. Use the ARN when referencing the incident from the chat or with AWS Command Line Interface (AWS CLI) commands.
-
Response Plan – Identifies the response plan for the selected incident. Choosing the response plan opens the response plan's details page.
-
Parent OpsItem – Identifies the OpsItem created as the parent of the incident. A parent OpsItem can have multiple related incidents and follow-up action items. Selecting the parent OpsItem opens the OpsItems details page in OpsCenter.
-
Analysis – Identifies the analysis created from this incident. Create an analysis from a resolved incident to improve your incident response process. Choose the analysis to open the analysis details page.
-
Owner – The account in which the incident was created.
In the Tags section, you can view and edit the tag keys and values associated with the incident record. For more information about tags in Incident Manager, see Tagging resources in Incident Manager.
