End of support notice: On December 15, 2025, AWS will end support for AWS IoT Analytics. After December 15, 2025, you will no longer be able to access the AWS IoT Analytics console, or AWS IoT Analytics resources. For more information, see AWS IoT Analytics end of support.
Visualizing AWS IoT Analytics data
To visualize your AWS IoT Analytics data, you can use the AWS IoT Analytics console or Quick Suite.
Topics
Visualizing AWS IoT Analytics data with the console
AWS IoT Analytics can embed the HTML output of your container dataset (found in the file
output.html) on the container dataset content page of the AWS IoT Analytics console
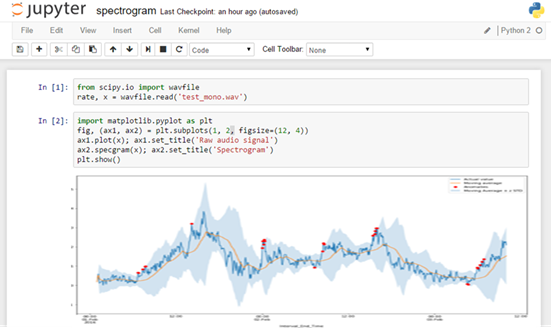
Then, after the container dataset content is created, you can view this visualization on the console's Data Set content page.

For information about creating a container dataset that runs a Jupyter notebook, see Automating your workflow.
Visualizing AWS IoT Analytics data with Quick Suite
AWS IoT Analytics provides direct integration with Quick Suite
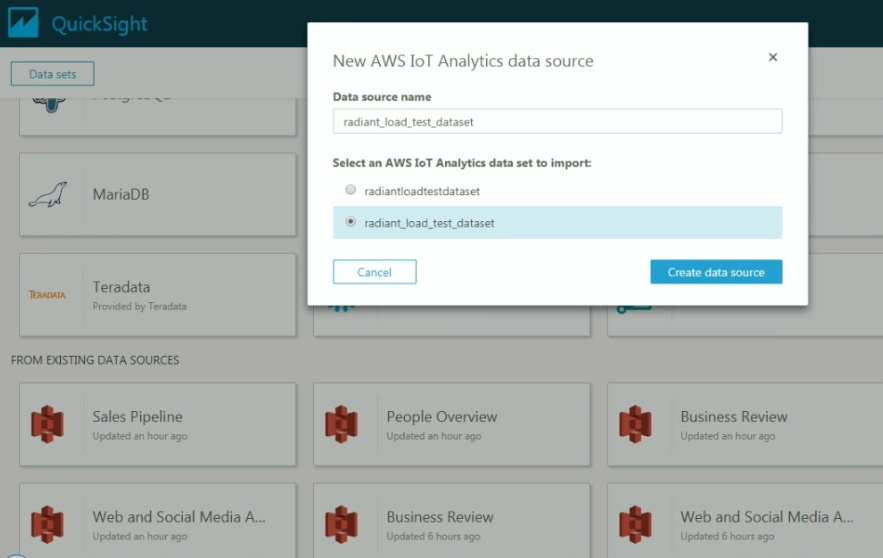
To get started with your Quick Suite visualizations, you must create a Quick Suite account. Make sure you give Quick Suite access to your AWS IoT Analytics data when you set up you account. If you already have an account, give Quick Suite access your AWS IoT Analytics data by choosing Admin, Manage QuickSight, Security & permissions. Under QuickSight access to AWS services, choose Add or remove, then select the check box next to AWS IoT Analytics and choose Update.

After your account is set up, from the admin Quick Suite console page choose New Analysis and New data set, and then choose AWS IoT Analytics as the source. Enter a name for your data source, choose a dataset to import, and then choose Create data source.
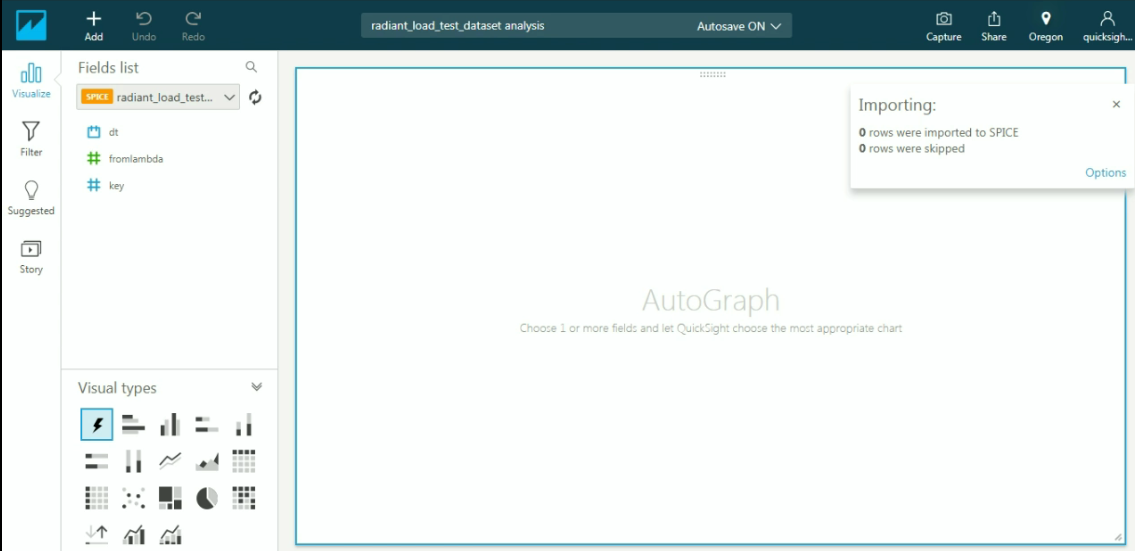
After your data source is created, you can create visualizations in Quick Suite.
For information about Quick Suite dashboards and datasets, see the Quick Suite documentation.
