翻訳は機械翻訳により提供されています。提供された翻訳内容と英語版の間で齟齬、不一致または矛盾がある場合、英語版が優先します。
クロスアカウントトレース
AWS X-Ray はクロスアカウントオブザーバビリティをサポートしているため、 内の複数のアカウントにまたがるアプリケーションをモニタリングおよびトラブルシューティングできます AWS リージョン。リンクされたアカウントのメトリクス、ログ、トレースをまとめてシームレスに検索、可視化、分析できます。これにより、複数のアカウントにまたがるリクエストの全体像を把握できます。クロスアカウントトレースは X-Ray のトレースマップと、CloudWatch コンソール
共有されるオブザーバビリティデータには、次のいずれかのタイプのテレメトリが含まれます。
-
Amazon CloudWatch のメトリクス
-
Amazon CloudWatch Logs のロググループ
-
のトレース AWS X-Ray
-
Amazon CloudWatch Application Insights のアプリケーション
クロスアカウントオブザーバビリティの設定
クロスアカウントオブザーバビリティを有効にするには、1 つ以上の AWS モニタリングアカウントを設定し、複数のソースアカウントにリンクします。モニタリングアカウントは、ソースアカウントから生成されたオブザーバビリティデータを表示して操作 AWS アカウント できる中央アカウントです。ソースアカウントは、含まれ AWS アカウント るリソースのオブザーバビリティデータを生成する個人です。
ソースアカウントは、オブザーバビリティデータをモニタリングアカウントと共有します。トレースは各ソースアカウントから最大 5 つのモニタリングアカウントにコピーされます。ソースアカウントから最初のモニタリングアカウントへのトレースのコピーは無料です。追加のモニタリングアカウントに送信されたトレースのコピーは、標準料金に基づいて各ソースアカウントに請求されます。詳細については、AWS X-Ray 料金表
モニタリングアカウントとソースアカウント間のリンクを作成するには、CloudWatch コンソールまたは AWS CLI および API の新しい Observability Access Manager コマンドを使用します。詳細については、「CloudWatch のクロスアカウントオブザーバビリティ」を参照してください。
注記
X-Ray トレースは、受信した AWS アカウント に請求されます。サンプルリクエストが複数のサービスにまたがる場合 AWS アカウント、各アカウントは個別のトレースを記録し、すべてのトレースは同じトレース ID を共有します。クロスアカウントオブザーバビリティ料金の詳細については、AWS X-Ray 料金
クロスアカウントトレースの表示
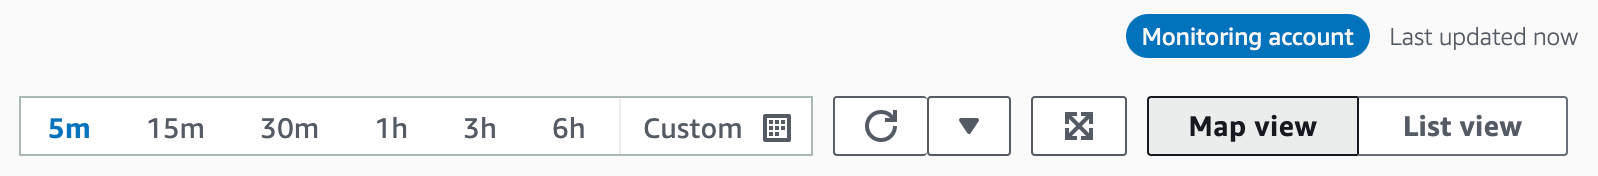
クロスアカウントトレースはモニタリングアカウントに表示されます。各ソースアカウントには、その特定のアカウントのローカルトレースのみが表示されます。以下のセクションでは、モニタリングアカウントにサインインしていて、Amazon CloudWatch コンソールを開いていることを前提としています。トレースマップページとトレースページの両方で、右上隅にモニタリングアカウントのバッジが表示されます。
トレースマップ
CloudWatch コンソールで、左側のナビゲーションペインから [X-Ray トレース] の下の [トレースマップ] を選択します。デフォルトでは、トレースマップには、モニタリングアカウントにトレースを送信するすべてのソースアカウントのノードと、モニタリングアカウント自体のノードが表示されます。トレースマップの左上から [フィルター] を選択し、[アカウント] ドロップダウンを使用してトレースマップをフィルターします。アカウントフィルターが適用されると、現在のフィルターと一致しないアカウントのサービスノードはグレー表示されます。
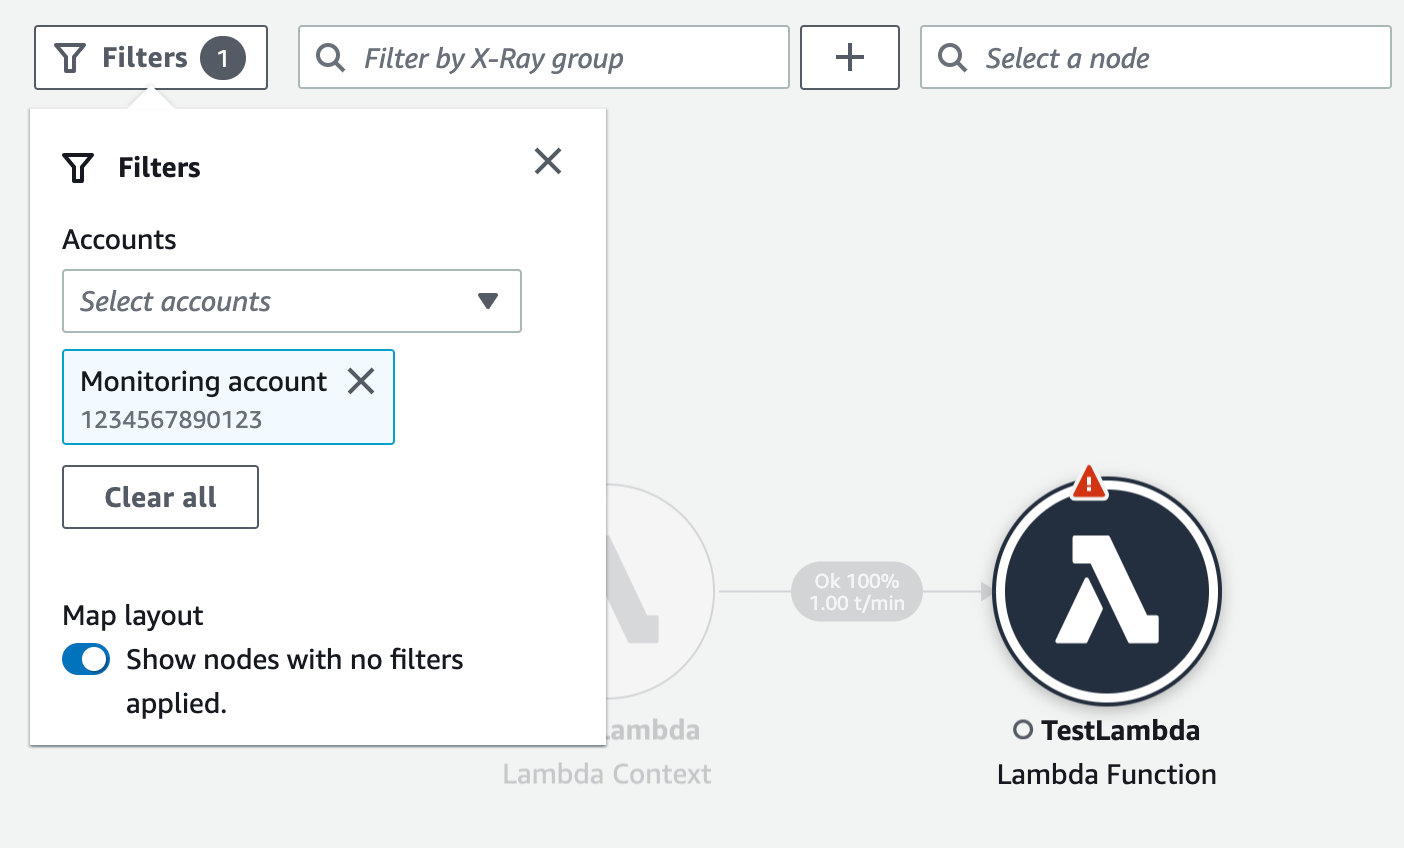
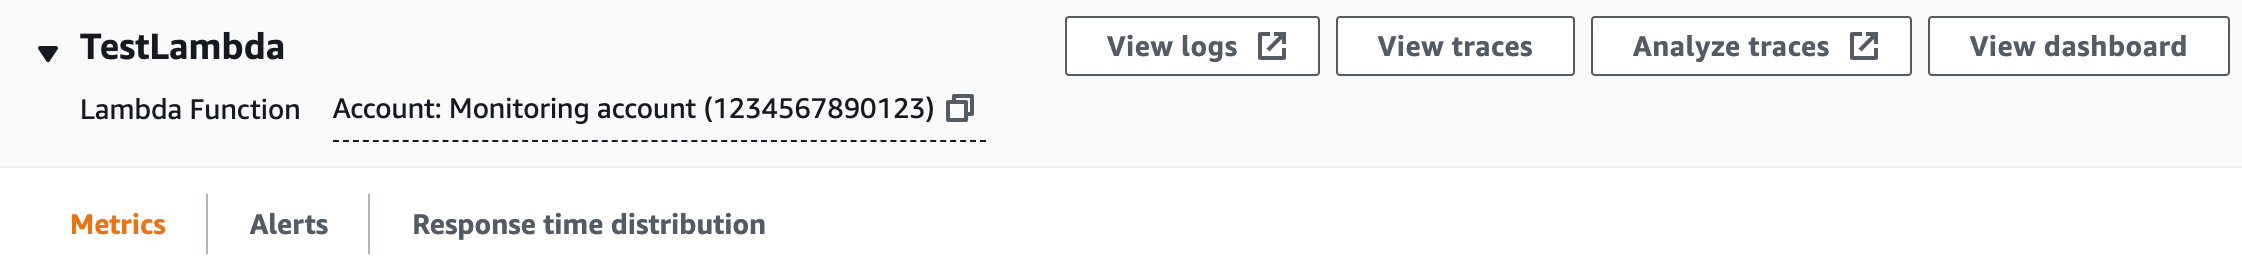
サービスノードを選択すると、[ノードの詳細] ペインにサービスのアカウント ID とラベルが表示されます。
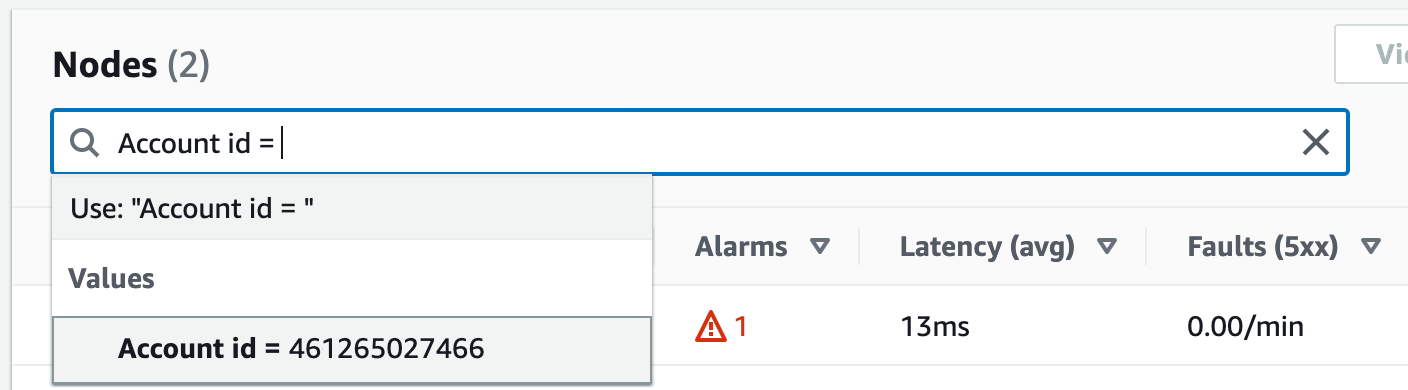
トレースマップの右上で、[リストビュー] を選択して、サービスノードのリストを表示します。サービスノードのリストには、モニタリングアカウントのサービスと、ソースアカウントに設定されているすべてのアカウントのサービスが含まれます。[ノード] フィルターで [アカウントラベル] または [アカウント ID] を選択して、ノードのリストをフィルタリングします。
トレース
モニタリングアカウントから CloudWatch コンソールを開き、左側のナビゲーションペインの [X-Ray トレース] で [トレース] を選択すると、複数のアカウントにまたがるトレースについてのトレースの詳細が表示されます。このページは、X-Ray [トレースマップ] でノードを選択し、ノードの詳細ペインから [トレースを表示] を選択して開くこともできます。
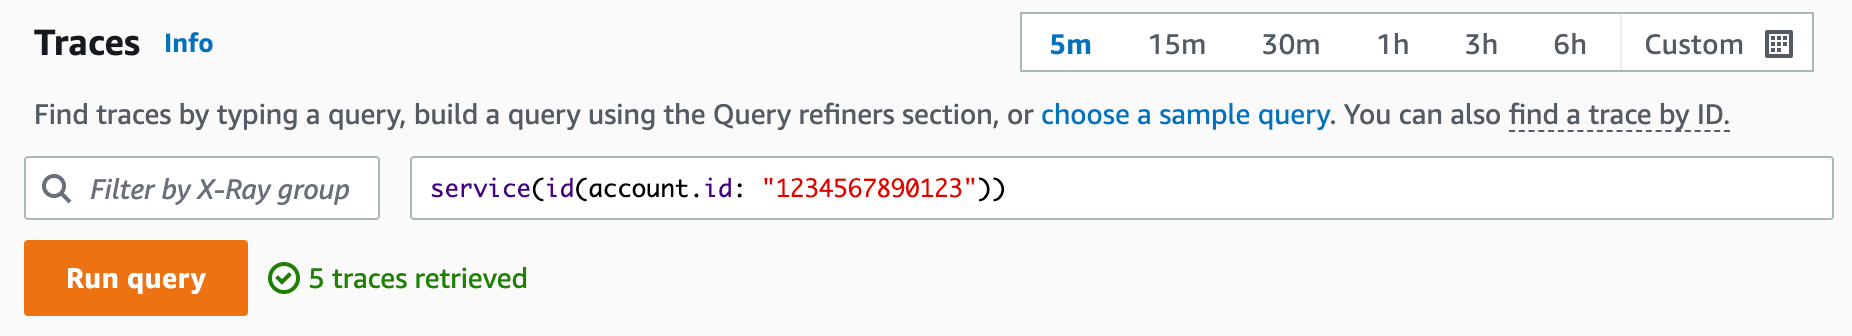
[トレース] ページでは、アカウント ID によるクエリがサポートされています。はじめに、1 つまたは複数のアカウント ID を含むクエリを入力します。次の例では、アカウント ID Xまたは Y を通過したトレースをクエリします。
service(id(account.id:"X")) OR service(id(account.id:"Y"))
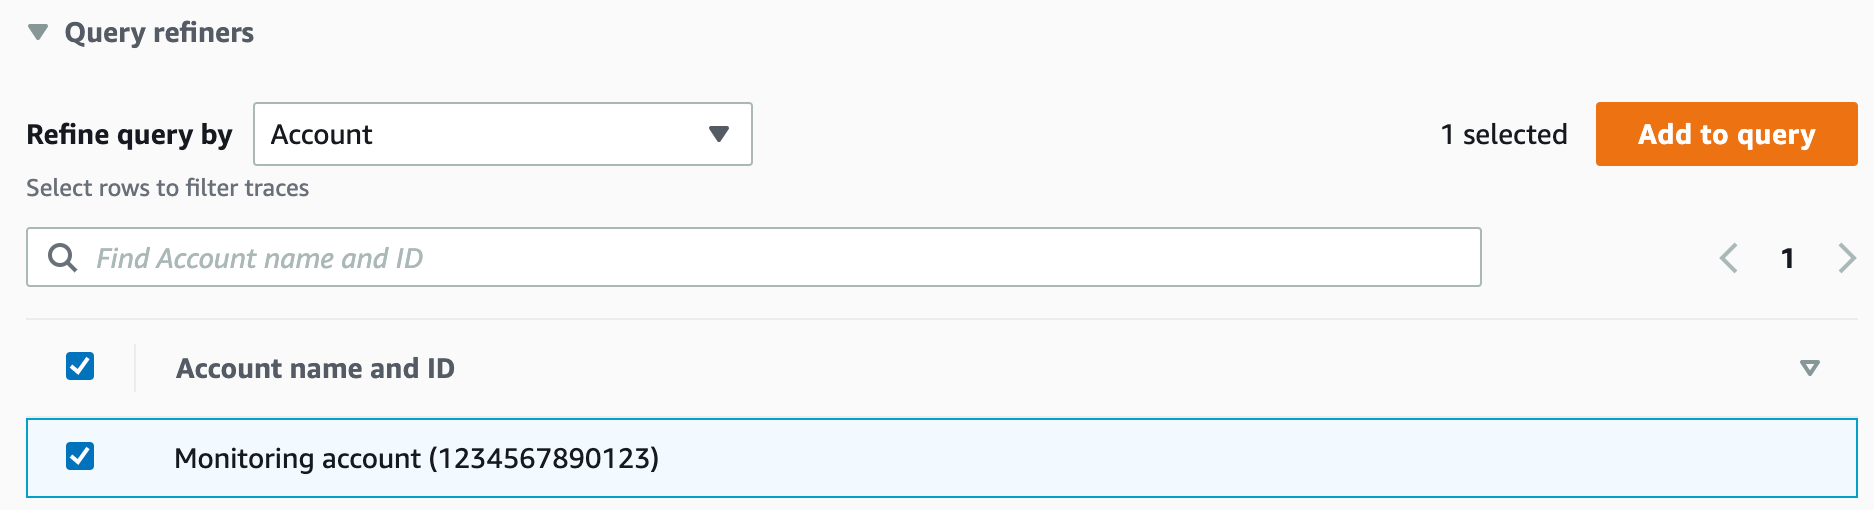
[アカウント] ごとにクエリを絞り込みます。リストから 1 つ以上のアカウントを選択し、[クエリに追加] を選択します。
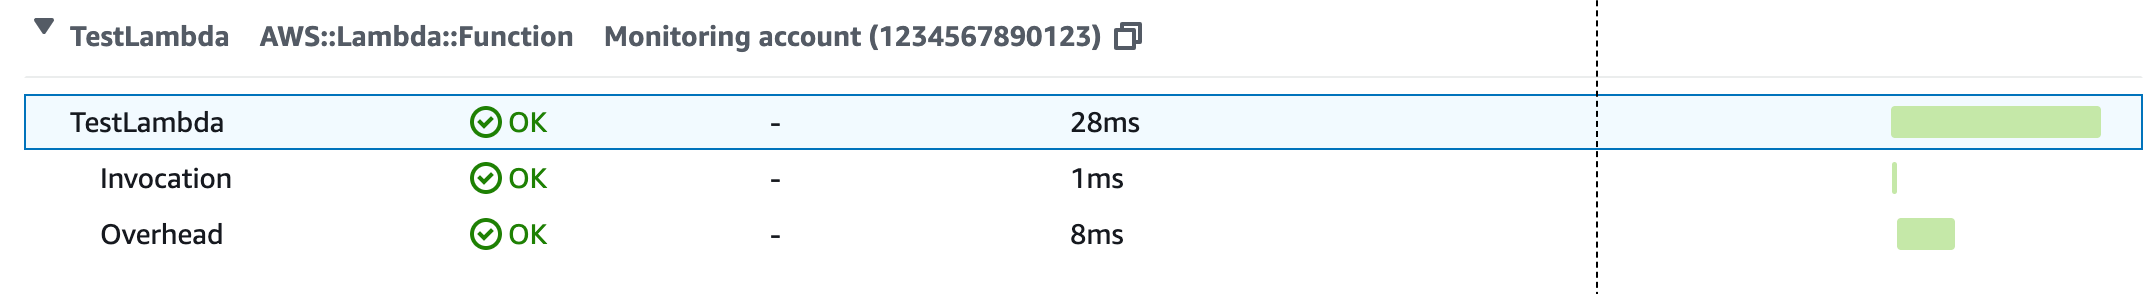
トレースの詳細
[トレース] ページの下部にある [トレース] リストからトレースを選択すると、トレースの詳細が表示されます。トレースが通過したすべてのアカウントのサービスノードを含むトレース詳細マップなど、[トレースの詳細] が表示されます。特定のサービスノードを選択すると、対応するアカウントが表示されます。
[セグメントのタイムライン] セクションには、タイムラインの各セグメントのアカウント詳細が表示されます。