Monitoring and troubleshooting Lambda functions
AWS Lambda integrates with other AWS services to help you monitor and troubleshoot your Lambda functions. Lambda automatically monitors Lambda functions on your behalf and reports metrics through Amazon CloudWatch. To help you monitor your code when it runs, Lambda automatically tracks the number of requests, the invocation duration per request, and the number of requests that result in an error.
You can use other AWS services to troubleshoot your Lambda functions. This section describes how to use these AWS services to monitor, trace, debug, and troubleshoot your Lambda functions and applications. For details about function logging and errors in each runtime, see individual runtime sections.
For more information about monitoring Lambda applications, see
Monitoring and observability
Sections
- Monitoring functions on the Lambda console
- Monitoring functions on the Lambda console
- View metrics for Lambda functions
- Using Amazon CloudWatch logs with AWS Lambda
- Logging AWS Lambda API calls using AWS CloudTrail
- Visualize Lambda function invocations using AWS X-Ray
- Monitor function performance with Amazon CloudWatch Lambda Insights
Monitoring functions on the Lambda console
The Lambda service monitors functions on your behalf and sends metrics to Amazon CloudWatch. The Lambda console creates monitoring graphs for these metrics and shows them on the Monitoring page for each Lambda function.
The Lambda console provides a single pane view of metrics, logs, and traces. The console provides filters for time range, time zone, and refresh options that apply to all panes universally. You can easily correlate metrics, logs, and traces, reducing the mean time to recovery (MTTR) when troubleshooting errors in your Lambda functions.
Pricing
CloudWatch has a perpetual free tier. Beyond the free tier threshold, CloudWatch charges for metrics, dashboards, alarms, logs, and insights. For more information, see Amazon CloudWatch pricing
Using the Lambda console
You can monitor your Lambda functions and applications on the Lambda console.
To monitor a function
Open the Functions page
of the Lambda console. -
Choose a function.
-
Choose the Monitor tab.
Types of monitoring graphs
The following section describes the monitoring graphs on the Lambda console.
Lambda monitoring graphs
-
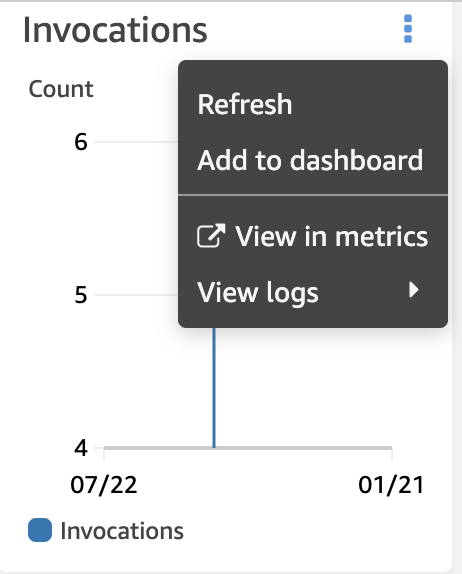
Invocations – The number of times that the function was invoked.
-
Duration – The average, minimum, and maximum amount of time your function code spends processing an event.
-
Error count and success rate (%) – The number of errors and the percentage of invocations that completed without error.
-
Throttles – The number of times that an invocation failed due to concurrency limits.
-
IteratorAge – For stream event sources, the age of the last item in the batch when Lambda received it and invoked the function.
-
Async delivery failures – The number of errors that occurred when Lambda attempted to write to a destination or dead-letter queue.
-
Concurrent executions – The number of function instances that are processing events.
Viewing graphs on the Lambda console
The following section describes how to view CloudWatch monitoring graphs on the Lambda console, and open the CloudWatch metrics dashboard.
To view monitoring graphs for a function
Open the Functions page
of the Lambda console. -
Choose a function.
-
Choose the Monitor tab.
-
Choose from the predefined time ranges, or choose a custom time range.
-
To see the definition of a graph in CloudWatch, choose the three vertical dots (Widget actions), and then choose View in metrics to open the Metrics dashboard on the CloudWatch console.
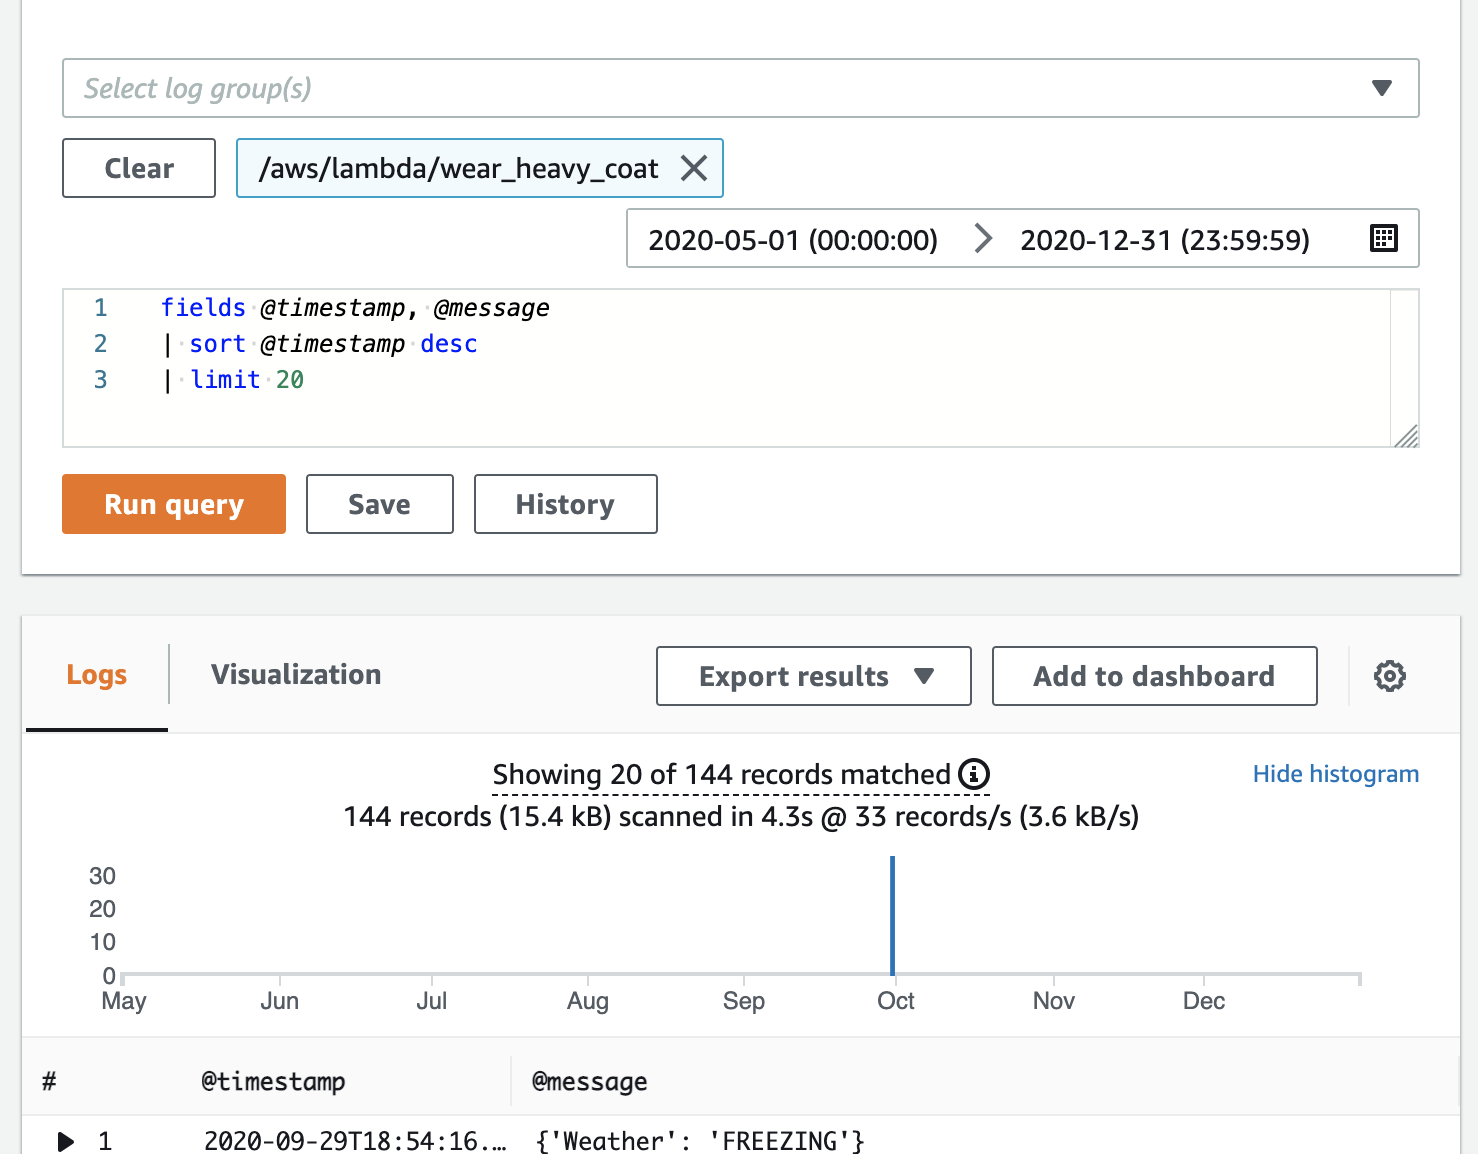
Viewing queries on the CloudWatch Logs console
The following section describes how to view and add reports from CloudWatch Logs Insights to a custom dashboard on the CloudWatch Logs console.
To view reports for a function
Open the Functions page
of the Lambda console. -
Choose a function.
-
Choose the Monitor tab.
-
Choose View logs in CloudWatch.
-
Choose View in Logs Insights.
-
Choose from the predefined time ranges, or choose a custom time range.
-
Choose Run query.
-
(Optional) Choose Save.