Visualize Lambda function invocations using AWS X-Ray
You can use AWS X-Ray to visualize the components of your application, identify performance bottlenecks, and troubleshoot requests that resulted in an error. Your Lambda functions send trace data to X-Ray, and X-Ray processes the data to generate a service map and searchable trace summaries.
Lambda supports two tracing modes for X-Ray: Active and
PassThrough. With Active tracing, Lambda automatically creates trace
segments for function invocations and sends them to X-Ray. PassThrough mode, on
the other hand, simply propagates the tracing context to downstream services. If you've enabled
Active tracing for your function, Lambda automatically sends traces to X-Ray for
sampled requests. Typically, an upstream service, such as Amazon API Gateway or an application hosted on
Amazon EC2 that is instrumented with the X-Ray SDK, decides whether incoming requests should be
traced, then adds that sampling decision as a tracing header. Lambda uses that header to decide
to send traces or not. Traces from upstream message producers, such as Amazon SQS, are automatically
linked to traces from downstream Lambda functions, creating an end-to-end view of the entire
application. For more information, see Tracing event-driven applications
in the AWS X-Ray Developer Guide.
Note
X-Ray tracing is currently not supported for Lambda functions with Amazon Managed Streaming for Apache Kafka (Amazon MSK), self-managed Apache Kafka, Amazon MQ with ActiveMQ and RabbitMQ, or Amazon DocumentDB event source mappings.
To toggle active tracing on your Lambda function with the console, follow these steps:
To turn on active tracing
Open the Functions page
of the Lambda console. -
Choose a function.
Choose Configuration and then choose Monitoring and operations tools.
Under Additional monitoring tools, choose Edit.
-
Under CloudWatch Application Signals and AWS X-Ray, choose Enable for Lambda service traces.
-
Choose Save.
Your function needs permission to upload trace data to X-Ray. When you activate tracing in the Lambda
console, Lambda adds the required permissions to your function's execution role. Otherwise, add the AWSXRayDaemonWriteAccess
X-Ray doesn't trace all requests to your application. X-Ray applies a sampling algorithm to ensure that tracing is efficient, while still providing a representative sample of all requests. The sampling rate is 1 request per second and 5 percent of additional requests. You can't configure the X-Ray sampling rate for your functions.
Understanding X-Ray traces
In X-Ray, a trace records information about a request that is processed by one or more services. Lambda records 2 segments per trace, which creates two nodes on the service graph. The following image highlights these two nodes:
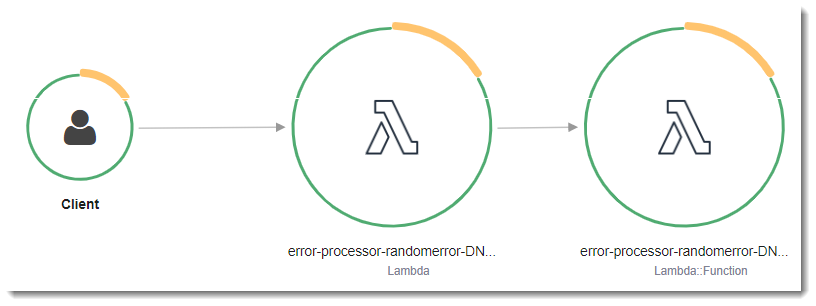
The first node on the left represents the Lambda service, which receives the invocation request. The second node represents your specific Lambda function.
The segment recorded for the Lambda service, AWS::Lambda, covers all the steps required to prepare the Lambda execution
environment. This includes scheduling the MicroVM, creating or unfreezing an execution environment with the resources you have configured,
as well as downloading your function code and all layers.
The AWS::Lambda::Function segment is for the work done by the function.
Note
AWS is currently implementing changes to the Lambda service. Due to these changes, you may see minor differences between the structure and content of system log messages and trace segments emitted by different Lambda functions in your AWS account.
This change affects the subsegments of the function segment. The following paragraphs describe both the old and new formats for these subsegments.
These changes will be implemented during the coming weeks, and all functions in all AWS Regions except the China and GovCloud regions will transition to use the new-format log messages and trace segments.
Old-style AWS X-Ray Lambda segment structure
The old-style X-Ray structure for the AWS::Lambda segment looks like the following:

In this format, the function segment has subsegments for Initialization, Invocation, and
Overhead. For SnapStart only, there is also a Restore subsegment
(not shown on this diagram).
The Initialization subsegment represents the init phase of the Lambda execution environment lifecycle.
During this phase, Lambda initializes extensions, initializes the runtime, and runs the function's initialization code.
The Invocation subsegment represents the invoke phase where Lambda invokes the function handler. This begins
with runtime and extension registration and it ends when the runtime is ready to send the response.
(Lambda SnapStart only) The Restore subsegment shows the time it takes for Lambda to restore a snapshot, load the
runtime, and run any after-restore runtime hooks. The process of restoring snapshots can include time spent on
activities outside the MicroVM. This time is reported in the Restore subsegment. You aren't charged for the time spent
outside the MicroVM to restore a snapshot.
The Overhead subsegment represents the phase that occurs between the time when the runtime sends the response and
the signal for the next invoke. During this time, the runtime finishes all tasks related to an invoke and prepares to freeze the sandbox.
Important
You can use the X-Ray SDK to extend the Invocation subsegment with additional
subsegments for downstream calls, annotations, and metadata. You can't access the function segment directly or
record work done outside of the handler invocation scope.
For more information about Lambda execution environment phases, see Understanding the Lambda execution environment lifecycle.
An example trace using the old-style X-Ray structure is shown in the following diagram.

Note the two segments in the example. Both are named my-function, but one has an origin of AWS::Lambda
and the other has an origin of AWS::Lambda::Function. If the AWS::Lambda segment shows an error, the Lambda service
had an issue. If the AWS::Lambda::Function segment shows an error, your function had an issue.
Note
Occasionally, you may notice a large gap between the function initialization and invocation phases in your X-Ray traces. For functions using provisioned concurrency, this is because Lambda initializes your function instances well in advance of invocation. For functions using unreserved (on-demand) concurrency, Lambda may proactively initialize a function instance, even if there's no invocation. Visually, both of these cases show up as a time gap between the initialization and invocation phases.
New-style AWS X-Ray Lambda segment structure
The new-style X-Ray structure for the AWS::Lambda segment looks like the following:

In this new format, The Init subsegment represents the init phase of the Lambda execution
environment lifecycle as before.
There is no invocation segment in the new format. Instead, customer subsegments are attached directly to the
AWS::Lambda::Function segment. This segment contains the following metrics as annotations:
-
aws.responseLatency- the time taken for the function to run -
aws.responseDuration- the time taken to transfer the response to the customer -
aws.runtimeOverhead- the amount of additional time the runtime needed to finish -
aws.extensionOverhead- the amount of additional time the extensions needed to finish
An example trace using the new-style X-Ray structure is shown in the following diagram.

Note the two segments in the example. Both are named my-function, but one has an origin of AWS::Lambda
and the other has an origin of AWS::Lambda::Function. If the AWS::Lambda segment shows an error, the Lambda service
had an issue. If the AWS::Lambda::Function segment shows an error, your function had an issue.
See the following topics for a language-specific introduction to tracing in Lambda:
For a full list of services that support active instrumentation, see Supported AWS services in the AWS X-Ray Developer Guide.
Default tracing behavior in Lambda
If you do not have Active tracing turned on, Lambda defaults to PassThrough
tracing mode.
In PassThrough mode, Lambda forwards the X-Ray tracing header to downstream
services, but does not send traces automatically. This is true even if the tracing header
contains a decision to sample the request. If the upstream service does not provide an X-Ray
tracing header, Lambda generates a header and makes the decision not to sample. However, you
can send your own traces by calling tracing libraries from your function code.
Note
Previously, Lambda would send traces automatically when upstream services, such as Amazon API Gateway, added a
tracing header. By not sending traces automatically, Lambda gives you the control to trace the functions that are
important to you. If your solution depends on this passive tracing behavior, switch to Active tracing.
Execution role permissions
Lambda needs the following permissions to send trace data to X-Ray. Add them to your function's execution role.
These permissions are included in the AWSXRayDaemonWriteAccess
Enabling Active tracing with the Lambda API
To manage tracing configuration with the AWS CLI or AWS SDK, use the following API operations:
The following example AWS CLI command enables active tracing on a function named my-function.
aws lambda update-function-configuration --function-name my-function \
--tracing-config Mode=Active
Tracing mode is part of the version-specific configuration when you publish a version of your function. You can't change the tracing mode on a published version.
Enabling Active tracing with CloudFormation
To activate tracing on an AWS::Lambda::Function resource in an CloudFormation template, use the
TracingConfig property.
Example function-inline.yml
Resources: function: Type: AWS::Lambda::Function Properties:TracingConfig: Mode: Active...
For an AWS Serverless Application Model (AWS SAM) AWS::Serverless::Function resource, use the Tracing
property.
Example template.yml
Resources: function: Type: AWS::Serverless::Function Properties:Tracing: Active...
