Using the Lambda Logs API
Important
The Lambda Telemetry API supersedes the Lambda Logs API. While the Logs API remains fully functional, we recommend using only the Telemetry API going forward. You can subscribe your extension to a telemetry stream using either the Telemetry API or the Logs API. After subscribing using one of these APIs, any attempt to subscribe using the other API returns an error.
Lambda Managed Instances do not support Logs API
Lambda Managed Instances do not support the Logs API. If you are using Managed Instance functions, use the Telemetry API instead. The Telemetry API provides enhanced capabilities for collecting and processing telemetry data from your Lambda functions.
Lambda automatically captures runtime logs and streams them to Amazon CloudWatch. This log stream contains the logs that your function code and extensions generate, and also the logs that Lambda generates as part of the function invocation.
Lambda extensions can use the Lambda Runtime Logs API to subscribe to log streams directly from within the Lambda execution environment. Lambda streams the logs to the extension, and the extension can then process, filter, and send the logs to any preferred destination.
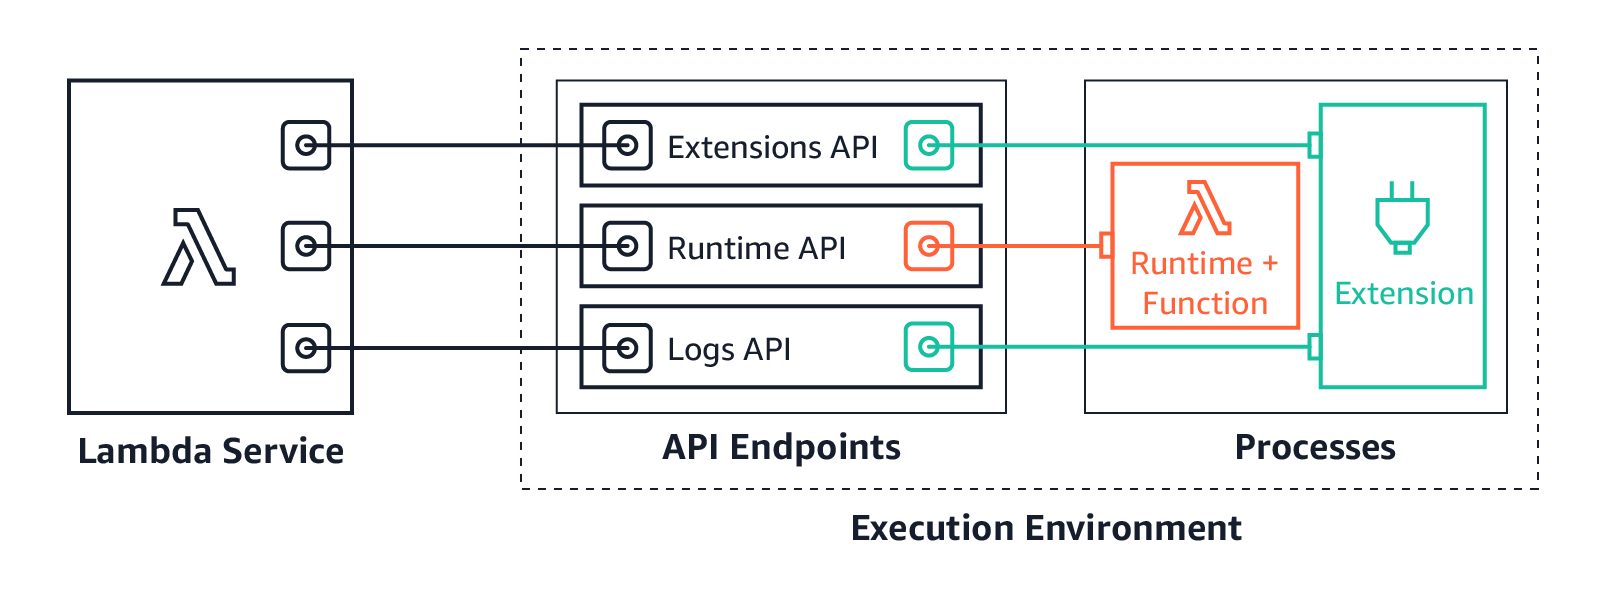
The Logs API allows extensions to subscribe to three different logs streams:
Function logs that the Lambda function generates and writes to
stdoutorstderr.Extension logs that extension code generates.
Lambda platform logs, which record events and errors related to invocations and extensions.
Note
Lambda sends all logs to CloudWatch, even when an extension subscribes to one or more of the log streams.
Topics
Subscribing to receive logs
A Lambda extension can subscribe to receive logs by sending a subscription request to the Logs API.
To subscribe to receive logs, you need the extension identifier (Lambda-Extension-Identifier).
First register the extension to receive the extension
identifier. Then subscribe to the Logs API during initialization.
After the initialization phase completes, Lambda does not process subscription requests.
Note
Logs API subscription is idempotent. Duplicate subscribe requests do not result in duplicate subscriptions.
Memory usage
Memory usage increases linearly as the number of subscribers increases. Subscriptions consume memory resources because each subscription opens a new memory buffer to store the logs. To help optimize memory usage, you can adjust the buffering configuration. Buffer memory usage counts towards overall memory consumption in the execution environment.
Destination protocols
You can choose one of the following protocols to receive the logs:
-
HTTP (recommended) – Lambda delivers logs to a local HTTP endpoint (
http://sandbox.localdomain:${PORT}/${PATH}) as an array of records in JSON format. The$PATHparameter is optional. Note that only HTTP is supported, not HTTPS. You can choose to receive logs through PUT or POST. -
TCP – Lambda delivers logs to a TCP port in Newline delimited JSON (NDJSON) format
.
We recommend using HTTP rather than TCP. With TCP, the Lambda platform cannot acknowledge when it delivers logs to the application layer. Therefore, you might lose logs if your extension crashes. HTTP does not share this limitation.
We also recommend setting up the local HTTP listener or the TCP port before subscribing to receive logs. During setup, note the following:
-
Lambda sends logs only to destinations that are inside the execution environment.
-
Lambda retries the attempt to send the logs (with backoff) if there is no listener, or if the POST or PUT request results in an error. If the log subscriber crashes, it continues to receive logs after Lambda restarts the execution environment.
-
Lambda reserves port 9001. There are no other port number restrictions or recommendations.
Buffering configuration
Lambda can buffer logs and deliver them to the subscriber. You can configure this behavior in the subscription request by specifying the following optional fields. Note that Lambda uses the default value for any field that you do not specify.
timeoutMs – The maximum time (in milliseconds) to buffer a batch. Default: 1,000. Minimum: 25. Maximum: 30,000.
maxBytes – The maximum size (in bytes) of the logs to buffer in memory. Default: 262,144. Minimum: 262,144. Maximum: 1,048,576.
maxItems – The maximum number of events to buffer in memory. Default: 10,000. Minimum: 1,000. Maximum: 10,000.
During buffering configuration, note the following points:
Lambda flushes the logs if any of the input streams are closed, for example, if the runtime crashes.
Each subscriber can specify a different buffering configuration in their subscription request.
Consider the buffer size that you need for reading the data. Expect to receive payloads as large as
2*maxBytes+metadata, wheremaxBytesis configured in the subscribe request. For example, Lambda adds the following metadata bytes to each record:{ "time": "2020-08-20T12:31:32.123Z", "type": "function", "record": "Hello World" }If the subscriber cannot process incoming logs quickly enough, Lambda might drop logs to keep memory utilization bounded. To indicate the number of dropped records, Lambda sends a
platform.logsDroppedlog. For more information, see Lambda: Not all of my function's logs appear.
Example subscription
The following example shows a request to subscribe to the platform and function logs.
PUT http://${AWS_LAMBDA_RUNTIME_API}/2020-08-15/logs HTTP/1.1
{ "schemaVersion": "2020-08-15",
  "types": [
      "platform",
      "function"
    ],
  "buffering": {
      "maxItems": 1000,
      "maxBytes": 262144,
      "timeoutMs": 100
    },
  "destination": {
    "protocol": "HTTP",
    "URI": "http://sandbox.localdomain:8080/lambda_logs"
  }
}
If the request succeeds, the subscriber receives an HTTP 200 success response.
HTTP/1.1 200 OK
"OK"
Sample code for Logs API
For sample code showing how to send logs to a custom destination, see Using AWS Lambda extensions to
send logs to custom destinations
For Python and Go code examples showing how to develop a basic Lambda extension and subscribe to the Logs API,
see AWS Lambda Extensions
Logs API reference
You can retrieve the Logs API endpoint from the AWS_LAMBDA_RUNTIME_API environment variable. To
send an API request, use the prefix 2020-08-15/ before the API path. For example:
http://${AWS_LAMBDA_RUNTIME_API}/2020-08-15/logs
The OpenAPI specification for the Logs API version 2020-08-15 is available here: logs-api-request.zip
Subscribe
To subscribe to one or more of the log streams available in the Lambda execution environment, extensions send a Subscribe API request.
Path – /logs
Method – PUT
Body parameters
destination – See Destination protocols. Required: yes. Type:
strings.
buffering – See Buffering configuration. Required: no. Type:
strings.
types – An array of the types of logs to receive. Required: yes. Type: array of strings.
Valid values: "platform", "function", "extension".
schemaVersion – Required: no. Default value: "2020-08-15". Set to "2021-03-18" for the
extension to receive platform.runtimeDone
messages.
Response parameters
The OpenAPI specifications for the subscription responses version 2020-08-15 are available for the HTTP and TCP protocols:
Response codes
-
200 – Request completed successfully
-
202 – Request accepted. Response to a subscription request during local testing.
-
4XX – Bad Request
-
500 – Service error
If the request succeeds, the subscriber receives an HTTP 200 success response.
HTTP/1.1 200 OK
"OK"
If the request fails, the subscriber receives an error response. For example:
HTTP/1.1 400 OK
{
    "errorType": "Logs.ValidationError",
    "errorMessage": URI port is not provided; types should not be empty"
}
Log messages
The Logs API allows extensions to subscribe to three different logs streams:
Function – Logs that the Lambda function generates and writes to
stdoutorstderr.Extension – Logs that extension code generates.
Platform – Logs that the runtime platform generates, which record events and errors related to invocations and extensions.
Function logs
The Lambda function and internal extensions generate function logs and write them to stdout or
stderr.
The following example shows the format of a function log message. { "time": "2020-08-20T12:31:32.123Z", "type": "function", "record": "ERROR encountered. Stack trace:\n\my-function (line 10)\n" }
Extension logs
Extensions can generate extension logs. The log format is the same as for a function log.
Platform logs
Lambda generates log messages for platform events such as platform.start,
platform.end, and platform.fault.
Optionally, you can subscribe to the 2021-03-18 version of the Logs API
schema, which includes the platform.runtimeDone log message.
Example platform log messages
The following example shows the platform start and platform end logs. These logs indicate the invocation start time and invocation end time for the invocation that the requestId specifies.
{
    "time": "2020-08-20T12:31:32.123Z",
    "type": "platform.start",
    "record": {"requestId": "6f7f0961f83442118a7af6fe80b88d56"}
}
{
    "time": "2020-08-20T12:31:32.123Z",
    "type": "platform.end",
    "record": {"requestId": "6f7f0961f83442118a7af6fe80b88d56"}
}
The platform.initRuntimeDone log message shows the status of the Runtime init sub-phase, which is part of the Init lifecyle phase. When Runtime init is successful, the runtime sends a /next runtime API request (for the on-demand and provisioned-concurrency initialization types) or restore/next (for the snap-start initialization type). The following example shows a successful platform.initRuntimeDone log message for the snap-start initialization type.
{
  "time":"2022-07-17T18:41:57.083Z",
  "type":"platform.initRuntimeDone",
  "record":{
      "initializationType":"snap-start",
      "status":"success"
  }
}
The platform.initReport log message shows how long the Init phase lasted and how many milliseconds you were billed for during this phase. When the initialization type is provisioned-concurrency, Lambda sends this message during invocation. When the initialization type is snap-start, Lambda sends this message after restoring the snapshot. The following example shows a platform.initReport log message for the snap-start initialization type.
{
  "time":"2022-07-17T18:41:57.083Z",
  "type":"platform.initReport",
  "record":{
      "initializationType":"snap-start",
      "metrics":{
          "durationMs":731.79,
          "billedDurationMs":732
          }
  }
}
The platform report log includes metrics about the invocation that the requestId specifies. The
initDurationMs field is included in the log only if the invocation included a cold start. If
AWS X-Ray tracing is active, the log includes X-Ray metadata. The following example shows a platform report
log for an invocation that included a cold start.
{
    "time": "2020-08-20T12:31:32.123Z",
    "type": "platform.report",
    "record": {"requestId": "6f7f0961f83442118a7af6fe80b88d56",
        "metrics": {"durationMs": 101.51,
            "billedDurationMs": 300,
            "memorySizeMB": 512,
            "maxMemoryUsedMB": 33,
            "initDurationMs": 116.67
        }
    }
}
The platform fault log captures runtime or execution environment errors. The following example shows a platform fault log message.
{
    "time": "2020-08-20T12:31:32.123Z",
    "type": "platform.fault",
    "record": "RequestId: d783b35e-a91d-4251-af17-035953428a2c Process exited before completing request"
}
Note
AWS is currently implementing changes to the Lambda service. Due to these changes, you may see minor differences between the structure and content of system log messages and trace segments emitted by different Lambda functions in your AWS account.
One of the log outputs affected by this change is the platform fault log "record" field. The following examples
show illustrative "record" fields in the old and new formats. The new style of fault log contains a more concise message
These changes will be implemented during the coming weeks, and all functions in all AWS Regions except the China and GovCloud regions will transition to use the new-format log messages and trace segments.
Example platform fault log record (old style)
"record":"RequestId: ...\tError: Runtime exited with error: exit status 255\nRuntime.ExitError"
Example platform fault log record (new style)
"record":"RequestId: ... Status: error\tErrorType: Runtime.ExitError"
Lambda generates a platform extension log when an extension registers with the extensions API. The following example shows a platform extension message.
{
    "time": "2020-08-20T12:31:32.123Z",
    "type": "platform.extension",
    "record": {"name": "Foo.bar",
        "state": "Ready",
        "events": ["INVOKE", "SHUTDOWN"]
     }
}
Lambda generates a platform logs subscription log when an extension subscribes to the logs API. The following example shows a logs subscription message.
{
    "time": "2020-08-20T12:31:32.123Z",
    "type": "platform.logsSubscription",
    "record": {"name": "Foo.bar",
        "state": "Subscribed",
        "types": ["function", "platform"],
    }
}
Lambda generates a platform logs dropped log when an extension is not able to process the number of logs
that it is receiving. The following example shows a platform.logsDropped log message.
{
    "time": "2020-08-20T12:31:32.123Z",
    "type": "platform.logsDropped",
    "record": {"reason": "Consumer seems to have fallen behind as it has not acknowledged receipt of logs.",
        "droppedRecords": 123,
        "droppedBytes" 12345
    }
}
The platform.restoreStart log message shows the time that the Restore phase started (snap-start initialization type only). Example:
{
  "time":"2022-07-17T18:43:44.782Z",
  "type":"platform.restoreStart",
  "record":{}
}
The platform.restoreReport log message shows how long the Restore phase lasted and how many milliseconds you were billed for during this phase (snap-start initialization type only). Example:
{
  "time":"2022-07-17T18:43:45.936Z",
  "type":"platform.restoreReport",
  "record":{
      "metrics":{
          "durationMs":70.87,
          "billedDurationMs":13
      }
  }
}
Platform runtimeDone messages
If you set the schema version to "2021-03-18" in the subscribe request, Lambda sends a
platform.runtimeDone message after the function invocation completes either successfully or
with an error. The extension can use this message to stop all the telemetry collection for this function
invocation.
The OpenAPI specification for the Log event type in schema version 2021-03-18 is available here: schema-2021-03-18.zip
Lambda generates the platform.runtimeDone log message when the runtime sends a
Next or Error runtime API request. The platform.runtimeDone log
informs consumers of the Logs API that the function invocation completes. Extensions can use this information
to decide when to send all the telemetry collected during that invocation.
Examples
Lambda sends the platform.runtimeDone message after the runtime sends the NEXT request when
the function invocation completes. The following examples show messages for each of the status values:
success, failure, and timeout.
Example success message
{
    "time": "2021-02-04T20:00:05.123Z",
    "type": "platform.runtimeDone",
    "record": {
       "requestId":"6f7f0961f83442118a7af6fe80b88",
       "status": "success"
    }
}
Example failure message
{
   "time": "2021-02-04T20:00:05.123Z",
   "type": "platform.runtimeDone",
   "record": {
      "requestId":"6f7f0961f83442118a7af6fe80b88",
      "status": "failure"
   }
}
Example timeout message
{
   "time": "2021-02-04T20:00:05.123Z",
   "type": "platform.runtimeDone",
   "record": {
      "requestId":"6f7f0961f83442118a7af6fe80b88",
      "status": "timeout"
  }
}
Example platform.restoreRuntimeDone message (snap-start initialization type only)
The platform.restoreRuntimeDone log message shows whether or not the Restore phase was successful. Lambda sends this message when the runtime sends a restore/next runtime API request. There are three possible statuses: success, failure, and timeout. The following example shows a successful platform.restoreRuntimeDone log message.
{
  "time":"2022-07-17T18:43:45.936Z",
  "type":"platform.restoreRuntimeDone",
  "record":{
      "status":"success"
  }
}
