Amazon Lookout for Equipment is no longer open to new customers.
Existing customers can continue to use the service as normal.
For capabilities similar to Amazon Lookout for Equipment see our
blog post
Use case: fluid pump
Example
Lookout for Equipment is designed primarily for stationary industrial equipment that operates continuously. This includes many types of equipment, including pumps, compressors, motors, and turbines.
As an example of using Lookout for Equipment on data from a high-level machine , let's look at a fluid pump.

In a simplified form, this fluid pump consists of three major components and their sensors. Note that this is just an example and not a complete list of features and components of such a pump.
-
Motor – The motor converts electricity into mechanical rotation. Key sensors might measure the current, voltage, or revolutions per minute (RPM).
-
Bearing – Bearings keep the rotating shaft in position while allowing it to rotate with minimal friction. Key sensors measure vibration.
-
Pump – The pump is an impeller that rotates on the shaft and pulls fluid from one direction and forces fluid in another direction, similar to a boat propeller. Key sensors measure inlet and outlet flow rate, pressure, and temperature.
For a simple application of Amazon Lookout for Equipment, let's say that the only available data consists of measurements of how fast the pump is spinning in RPM, and the outlet flow rate of the fluid. The following historical time-series plots show both sets of measurements.
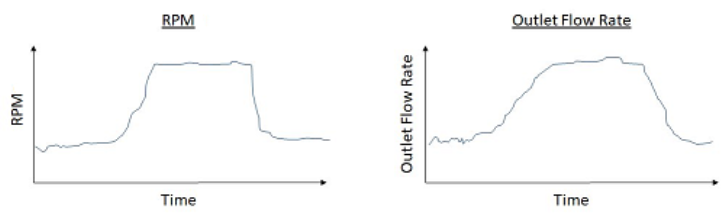
These graphs show the expected relationship between RPM and flow rate: as the pump rotates faster, the fluid flows faster. The graphs show two operating modes: one with low RPM and a low flow rate, and a second mode with high RPM and high flow rate. In this case, Amazon Lookout for Equipment wants to learn this normal relationship in terms of operating modes. .The following graph shows another way to visualize the learned normal operating modes.

The normal behavior of this pump is clear. The operator runs the pump at low RPM and high RPM in order to get a low flow rate or a high flow rate. As the pump continues to run, we expect that the data will continue to fall into one of these two operating modes. However, if the pump starts to have problems, this relationship might not hold true.
Over time, the impeller (the part similar to a boat propeller) starts to rust, chip, loosen, or become misaligned. As this happens, the data might show abnormal behavior. When the pump rotates at higher a RPM, the flow rate remains low, as shown in the following graph.

These types of issues are precisely what Amazon Lookout for Equipment is designed to detect.
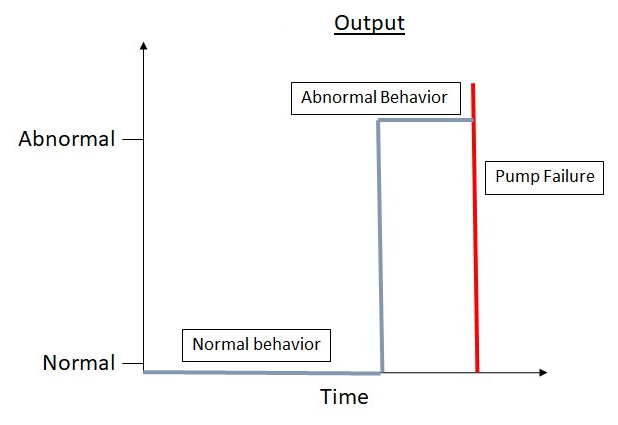
In this case, we see a simple representation of the normal operating states of the pump and abnormal behavior if the pump has an issue. The following graph shows a simplified view of how Lookout for Equipment detects the output over time. When the relationship between RPM and flow rate is normal, Lookout for Equipment detects that everything is normal. However, as the RPM increases but the flow rate stays the same, Lookout for Equipment starts detecting abnormal behavior. The vertical red line denotes the potential failure point for the pump, at which unplanned downtime occurs.
This is a very simple example of a straightforward application with only two inputs (RPM and flow rate) that have a direct linear relationship with each other. The situation become dramatically more complex when we add additional inputs, such as pressure, temperature, motor current, motor voltage, bearing vibration, and so on. The more you increase the number of inputs, the more complex the relationships between all of the inputs becomes. With some equipment, the number of inputs can easily reach into the hundreds. In addition, this simplified example doesn't attempt to represent the time-series aspect of the problem—the model also has to learn the changes in relationships over time. For example, even subtle changes in vibration over time can be critical to detecting issues.
Amazon Lookout for Equipment works with up to 300 inputs at once. Keep in mind that to accurately analyze the data, Lookout for Equipment requires that the inputs are related to issues that you want to find, and that the historical data used to train (and evaluate) the model represents the equipment's normal behavior.
