End of support notice: On October 31, 2025, AWS
will discontinue support for Amazon Lookout for Vision. After October 31, 2025, you will
no longer be able to access the Lookout for Vision console or Lookout for Vision resources.
For more information, visit this
blog post
Using the Amazon Lookout for Vision dashboard
The dashboard provides an overview of metrics for your Amazon Lookout for Vision projects, such as the total number of anomalies detected over the last week. With the dashboard you get an overview for all of your projects and an overview for each individual project. You can choose the timeline over which metrics are shown. You can also use the dashboard to create a new project.
The Overview section shows the total number of projects, total number of images, and the total number of images detected by all of your projects.
The Projects section shows the following overview information for individual projects:
The total number or anomalies detected.
The total number of images processed.
The total anomaly ratio (that is, the percentage of images detected with an anomaly).
A graph shows the anomaly detections over the chosen time frame.
You can also get further information about a project.

To use your dashboard
Open the Amazon Lookout for Vision console at https://console.aws.amazon.com/lookoutvision/
. Choose Get started.
In the left navigation pane, choose Dashboard.
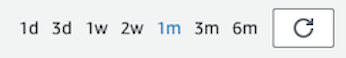
To view metrics over a specific time frame, do the following:
Choose the time frame in the upper-right side of the dashboard.
Choose the refresh button to show the dashboard with the new timeline.
To get further details about a project, choose the project name in the Projects section (for example,
ManufacturingLine01).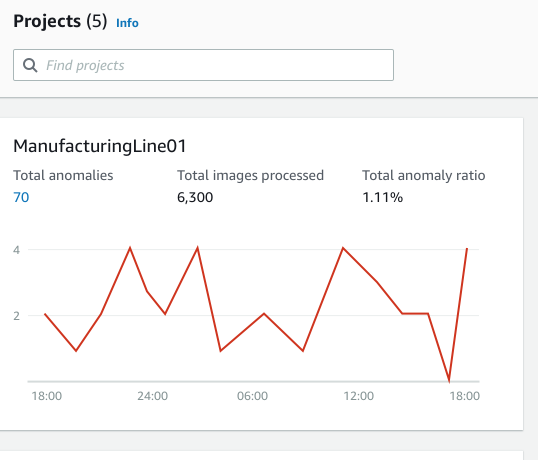
To create a project, choose Create project in the Projects section.
