Access Cloud WAN core network dashboards
Use the following dashboards to view information about your Cloud WAN core network. For more information about the Cloud WAN core network dashboards, see Cloud WAN core network dashboards.
Core network dashboards
Overview
On the AWS Cloud WAN console Overview page, you can view the following information:
-
Your core network resource inventory.
-
The location of core network edges and transit gateways within your global network, displayed as icons on a map. Connections are shown between resources.
-
Throughput information between core network edges.
-
The number of core network attachments per edge, shown as a stacked column chart. You can filter this chart to display specific attachment types.
-
The number of network function groups used to route specific traffic to security appliances.
Use the following legend to understand the icons on your core network map:
| Icon | Description |
|---|---|

|
Edge locations The total number of edge locations in your core network. The number is shown in the Inventory section and as an icon on the map for each edge location in your core network. |

|
Segments The total number of segments in your core network. The number is shown in the Inventory section and as an icon on the map for each section in your core network. |

|
Network function groups The total number of network function groups in your core network. The number is shown in the Inventory section and as an icon on the map for each section in your core network. |

|
Devices
The total number of devices in your core network. The number is shown in the Inventory section and as an icon on the map for each device in your core network. |

|
Sites
The total number of sites in your core network. The number is shown in the Inventory section and as an icon on the map for each site in your core network. |
To view the core network map
Access the Network Manager console at https://console.aws.amazon.com/networkmanager/home/
. -
Under Connectivity, choose Global networks.
-
On the Global networks page, choose the global network ID.
In the navigation pane, choose Core network.
The Overview page opens by default.
-
The Inventory section shows information about your core network: the number of Edge locations in your core network, the number of Segments, the number of Devices, and the number of Sites.
-
The Geography section displays a world map with the locations of your resources.
-
The Throughput section shows throughput information between the core network edges.
-
(Optional) Metrics and events use the default time set up in the CloudWatch Events event. To set a custom time frame, choose Custom and then choose a Relative or Absolute time, and then choose if you want to see that date range in UTC or the edge location's Local time zone.
Choose Add to dashboard to add this metric to your CloudWatch dashboard. For more information about using CloudWatch dashboards, see Using Amazon CloudWatch Dashboards in the Amazon CloudWatch User Guide.
Note
The Add to dashboard option only works if your registered transit gateway is in the US West (Oregon) Region.
-
-
The Attachment section displays information about each attachment for each core network edge location. Choose the Filter by attachment type dropdown list. By default all attachment types are chosen. Clear the check box for any attachment type that you don't want to include in the graph. You can filter by any combination of:
-
VPN
-
VPC
-
Connect
-
Details
The Details page provides information about your core network resources.
To view your core network details
Access the Network Manager console at https://console.aws.amazon.com/networkmanager/home/
. -
Under Connectivity, choose Global networks.
-
On the Global networks page, choose the global network ID.
In the navigation pane, choose Core network.
The Overview page opens by default.
-
Choose the Details tab.
The Details page shows the following information:
-
Name — The name that you gave to the core network when you created it.
-
State — The current state of the core network. Possible states are Pending, Available, Deleting, and Updating.
-
Core network ARN — The unique Amazon Resource Number (ARN) of the core network.
-
AWS account — The AWS account that's associated with the core network.
-
Description — The description given to the core network when it was created.
-
Tags — The key-value tags that were associated with the core network when it was created.
-
-
(Optional) Change the core network Description. Choose Edit in the Core network details section, and then in the Description field, replace the current description with a new description. Then choose Edit core network to save your change.
-
(Optional) Edit, remove or add Tags. In the Tags section choose Edit tags and do any of the following. When finished, choose Edit core network to return to the Details tab.
-
Choose Add tag to add a new tag. Add Key and Value pairs to help identify this resource. You can add multiple tags.
-
Choose Remove tag to delete any tag. You are not prompted to confirm the deletion.
-
To edit an existing tag, enter the new Key or Value into the applicable field.
-
Sharing
On the Sharing page, you can view your currently shared network resources. You can also use AWS Resource Access Manager (RAM) to share a core network across accounts or across your organization in AWS organizations.
To view shared network resources
Access the Network Manager console at https://console.aws.amazon.com/networkmanager/home/
. -
Under Connectivity, choose Global networks.
-
On the Global networks page, choose the global network ID.
In the navigation pane, choose Core network.
The Overview page opens by default.
-
Choose the Sharing tab.
The Resource sharing page displays a list of the resources that you're currently sharing.
-
If you want to share a network resource. See Shared AWS Cloud WAN core network for the steps to share a network resource.
Topology graph
On the Topology graph page, you can view a topology diagram of your core network that includes core network and transit gateway networks. It includes information about AWS Regions, core network edges, segments, VPCs, VPNs, and Connect attachments. Icons represent specific resource type and lines represent connections between resources. The line colors represent the state of the connection between AWS and the on-premises resources. You can filter the topology view to show specific segment, and exclude AWS Regions and labels that are shown.
Use the following legend to understand the icons on your core network topology graph:
| Icon | Description |
|---|---|

|
Core network edge The core network edges in your network. |

|
VPC The VPC attachments in your core network. |

|
Connect
The Connect attachments in your core network. |
|
|
Segment
The segments in your core network. |
|
|
Devices
The devices in your core network. |

|
VPN
The VPN attachments in your core network. |

|
Direct Connect Gateway
The Direct Connect Gateway attachments in your core network. |
To view the core network topology graph
Access the Network Manager console at https://console.aws.amazon.com/networkmanager/home/
. -
Under Connectivity, choose Global networks.
-
On the Global networks page, choose the global network ID.
In the navigation pane, choose Core network.
The Overview page opens by default.
-
Choose the Topology graph tab.
A topological representation of your global network is displayed. Connect lines are created between your resources.
-
(Optional) Filter the information displayed in the topology by making choices for any combination of the following:
-
Label — Turns resource labels on or off.
-
Segment — Turns the display segments on or off.
-
Cluster — Turns the display of a cluster on or off.
-
-
On the graph, choose any of your network resources to view details about that resource. A panel opens on the right-hand side of the graph.
In this example, the
developmentsegment is chosen in the graph. The panel displays Details about the segment. Choose the Routes tab to view the segment routes.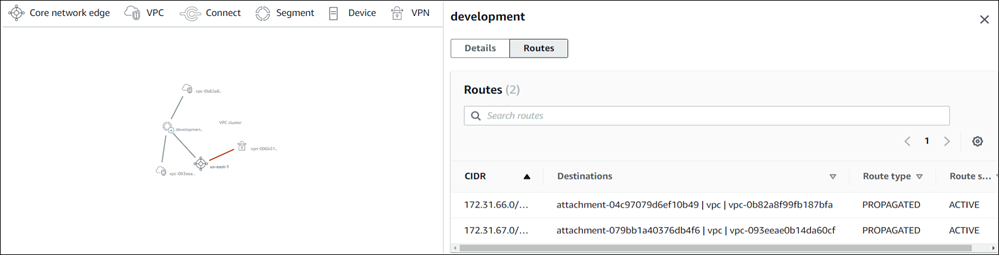
Depending on the resource chosen, the following information is available in the panel:
-
Core network edge — Details, Metrics, and Events. See AWS Cloud WAN events and metrics for more information about the types of metrics and events that can be tracked.
-
VPC, Connect, VPN, and Direct Connect Gateway — Details and Events.
-
Segment — Details and Routes.
-
Device — Device Details.
-
Topology tree
The Topology tree page shows a logical diagram of your core network. Here you can view the network tree for your core network. By default, the page displays all resources in your core network and the logical relationships between them. You can filter the network tree to show specific on-premises resource types only. For example, the preceding image shows sites and devices, and excludes customer gateways. You can choose any of the nodes to view information about the specific resource it represents. The line colors represent the state of the relationships between AWS and the on-premises resources.
To view the topology tree
Access the Network Manager console at https://console.aws.amazon.com/networkmanager/home/
. -
Under Connectivity, choose Global networks.
-
On the Global networks page, choose the global network ID.
In the navigation pane, choose Core network.
The Overview page opens by default.
-
Choose the Topology tree tab.
A logical representation of your global network is displayed, along with the details of your global network configuration.
-
(Optional) Filter the information that is displayed in the topology by making choices for any combination of the following:
-
Site — Turns the display of sites on or off.
-
Device — Turns the display of devices on or off.
-
Customer Gateway — Turns the display of customer gateways on or off.
-
Segment — Turns the display of segments on or off.
-
-
On the tree, choose the label of any of your network resources to view details about that resource. A panel opens on the right-hand side of the tree.
In this example, an edge location, us-west-1, is chosen in the tree. The panel displays Edge location details. Choose any of the tabs in the panel to view more information about that edge location.
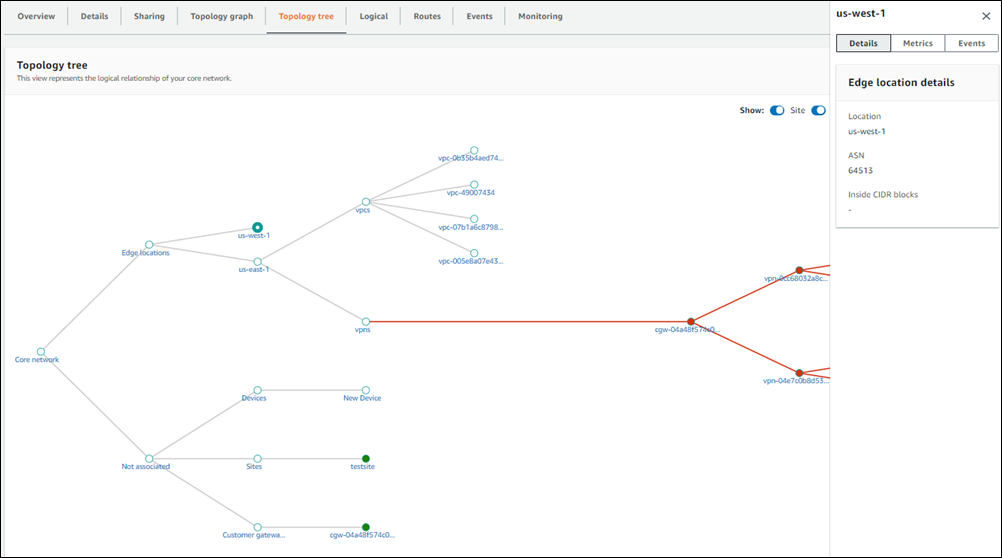
Depending on the resource chosen, the following information is available in the panel. See AWS Cloud WAN events and metrics for more information about the types of events that can be tracked.
-
Core network - Core network details, including the AWS account and current State of the core network.
-
Sites — Details and Events.
-
Devices — Details and Events.
-
Customer Gateway — Details and Events.
-
Segment — Details and Events.
-
Not associated — There is no information to return.
-
Logical
The Logical page shows a logical representation of the segments in your core network. You can filter by a specific source or destination segment, or by a source or destination attachment. You can view the network tree for your global network, which includes core network and transit gateway networks. By default, the page displays all resources in your global network and the logical relationships between them. You can filter the network tree to show specific on-premises resource types only. For example, the preceding image shows sites and devices, and excludes customer gateways. You can choose any of the nodes to view information about the specific resource that it represents. The line colors represent the state of the relationships between AWS and any on-premises resources.
Use the following legend to understand the icons on your core network logical graph:
| Icon | Description |
|---|---|
|
|
VPC The VPC attachments in your core network. |
|
|
Connect
The Connect attachments in your core network. |
|
|
Segment
The segments in your core network. |

|
Network function group
The network function groups in your core network. |
|
|
VPN
The VPN attachments in your core network. |

|
Transit gateway route table
The transit gateway route table attachments in your core network. |
|
|
Direct Connect gateway attachment
The Direct Connect gateway attachments in your core network. |
To access the logical diagram for a core network
Access the Network Manager console at https://console.aws.amazon.com/networkmanager/home/
. -
Under Connectivity, choose Global networks.
-
On the Global networks page, choose the global network ID.
In the navigation pane, choose Core network.
The Overview page opens by default.
-
Choose the Logical tab.
By default, all segments and all attachments are displayed in the logical representation.
-
(Optional) Do any of the following:
-
From the Source segment dropdown list, choose a segment from the core network.
-
From the Source attachment dropdown list, choose an attachment from the source segment.
-
From the Destination segment dropdown list, choose a destination segment from the core network.
-
From the Destination attachment dropdown list, choose an attachment from the destination segment.
The logical graph updates based on your choices. Choose Clear to reset the page.
-
-
(Optional) Filter the information that is displayed in the topology by making choices for any combination of the following:
-
Attachments — Turns the display of attachments on or off.
-
Show unassociated attachments — Turns the display of unassociated attachments on or off.
-
-
On the graph, choose any of your network resources to view details about that resource. A panel opens on the right-hand side of the graph.
In this example, a segment, segment-b, is chosen in the graph. The panel displays Segment details.
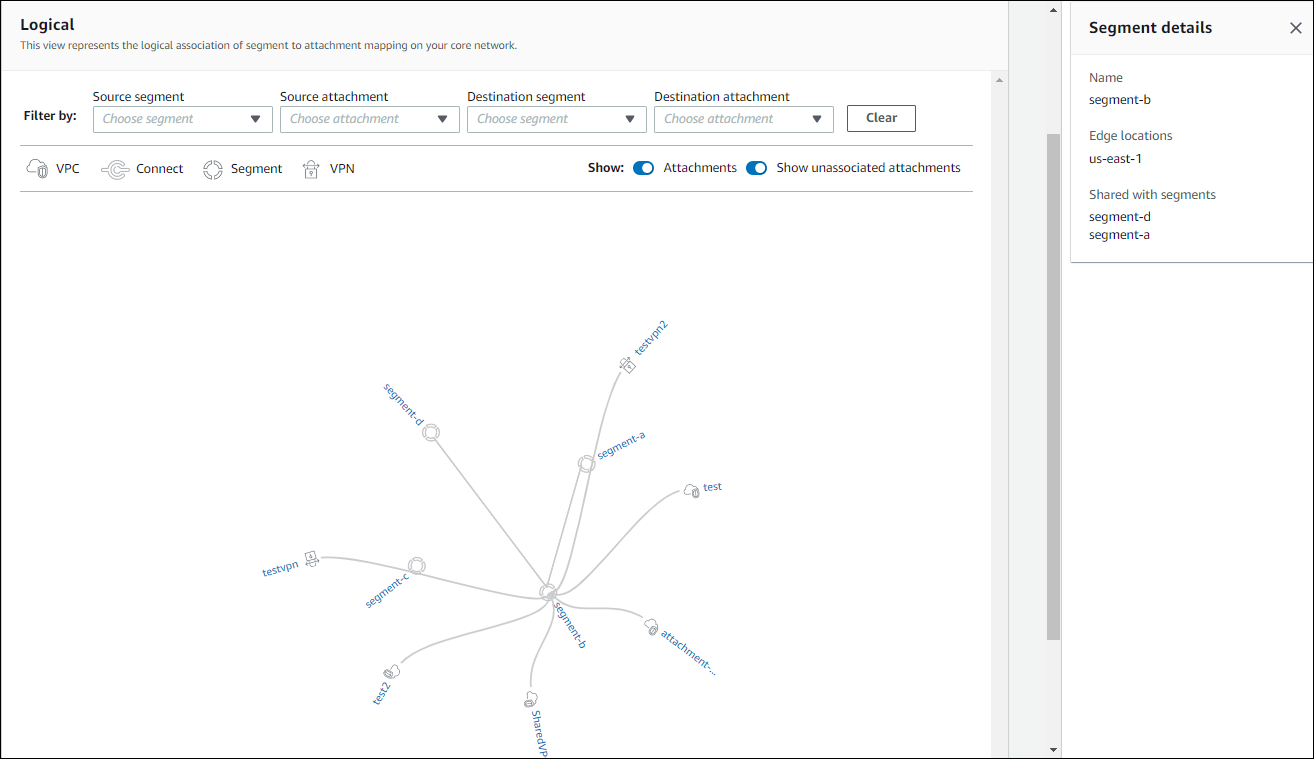
Depending on the resource chosen, the following information is available in the panel:
-
VPC, Connect, VPN, Transit gateway route table, and Direct Connect Gateway — Attachment Details and Events. See AWS Cloud WAN events and metrics for more information about the types of events that can be tracked.
-
Segment — Segment details and Routes.
-
Network function groups — Edge locations and Send to/Send via.
-
Routes
On the Routes page, you can search for and view core network routes. On this page, you can refine results to show routes for specific segments and edge locations.
To access core network routes
Access the Network Manager console at https://console.aws.amazon.com/networkmanager/home/
. -
Under Connectivity, choose Global networks.
-
On the Global networks page, choose the global network ID.
In the navigation pane, choose Core network.
The Overview page opens by default.
-
Choose the Routes tab.
-
In the Routes filter section, choose one of the following:
-
Choose Segment, and then from the Segment and Edge location drop-down lists, choose the segment and edge location.
-
Choose Network function group, and then from the Network function group and Edge location drop-down lists, choose the network function group and edge location that you want to create a route filter for.
-
-
Choose Search routes.
The Routes table updates to display the routes for the chosen segment and edge location and includes the following:
-
CIDR — All CIDRs used by this route.
-
Destinations — All destination addresses.
-
Route types — The type of route. This will be either PROPAGATED or STATIC.
-
Route state — The current state of a route. This will be either ACTIVE or BLACKHOLE.
-
Routing information base
On the Routing information base page, you can search for and view core network routing information base entries. The routing information base shows all route candidates before any routing policies have been applied. Unlike the Routes view which shows the final installed routes, the routing information base includes all prefixes advertised with their BGP attributes: local preference, AS path, MED, and BGP community tags. This view of your routes with BGP attributes can be useful to help you design your routing policies. On this page, you can refine results to show routing information base entries for specific segments and edge locations.
To access core network routing information base
Access the Network Manager console at https://console.aws.amazon.com/networkmanager/home/
. -
Under Connectivity, choose Global networks.
-
On the Global networks page, choose the global network ID.
In the navigation pane, choose Core network.
The Overview page opens by default.
-
Choose the Routing information base tab.
-
In the Routing filter section, from the Segment and Edge location drop-down lists, choose the segment and edge location that you want the routing information base entries on.
-
(Optional) In the Additional filters section, you can select up to 10 additional attribute values to refine your search. From the Attribute drop-down list, choose any number of the following attributes to filter on:
-
MED
-
AS Path
-
Community
-
Local Preference
-
Resource ID
-
Resource Type
-
IP Address
-
Attachment ID
-
Next hop segment
-
Next hop edge location
-
-
Choose Get routing information.
The Route information base table updates to display the route information base entries for the chosen segment and edge location and includes the following:
-
Prefix — The prefix of the route.
-
Next Hop — The destination of the route.
-
Local preference — The local preference BGP attribute of the route.
-
AS Path — The AS path BGP attribute of the route.
-
MED — The Multi-Exit Discriminator BGP attribute of the route.
-
Community — List of BGP community tags for the route.
-
Events
You can monitor your core network using Amazon EventBridge, which delivers a near-real-time stream of system events that describe changes in your resources. Using simple rules that you can quickly set up, you can match events and route them to one or more target functions or streams. For more information, see the Amazon EventBridge User Guide.
Prerequisites: Before monitoring events, you must onboard CloudWatch Logs Insights. This is a one-time process that needs to be completed at the account level. After this is set up for your core network, you'll be able to see event updates on this page. For more information on AWS Cloud WAN events, see AWS Cloud WAN events and metrics.
To access core network events
Access the Network Manager console at https://console.aws.amazon.com/networkmanager/home/
. -
Under Connectivity, choose Global networks.
-
On the Global networks page, choose the global network ID.
In the navigation pane, choose Core network.
The Overview page opens by default.
-
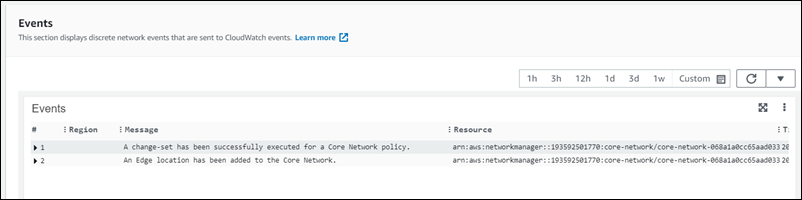
Choose the Events tab.
The Events section updates with the EventBridge events that occurred during the selected time frame.
-
(Optional) Metrics and events use the default time set up in the CloudWatch Events event. To set a custom time frame, choose Custom and then choose a Relative or Absolute time, and then choose if you want to see that date range in UTC or the edge location's Local time zone.
Choose Add to dashboard to add this metric to your CloudWatch dashboard. For more information about using CloudWatch dashboards, see Using Amazon CloudWatch Dashboards in the Amazon CloudWatch User Guide.
Note
The Add to dashboard option only works if your registered transit gateway is in the US West (Oregon) Region.
-
In the following example, the Events section shows two events occurring within a custom 15-month time frame:
-
A change set was executed successfully for a core network policy update.
-
An edge location was added to the core network.
For a full list of tracked events, see Monitor with Amazon CloudWatch Events.
-
Monitoring
You can monitor your core network by using Amazon CloudWatch, which collects raw data and processes it into readable, near-real-time metrics. These statistics are kept for 15 months, so that you can access historical information and gain a better perspective on how your network is performing. You can also set alarms that watch for certain thresholds, and send notifications or take actions when those thresholds are met. For more information, see the Amazon CloudWatch User Guide.
On the monitoring page you can view usage metrics for your core network, filtering by specific edge locations.
To access core network monitoring details
Access the Network Manager console at https://console.aws.amazon.com/networkmanager/home/
. -
Under Connectivity, choose Global networks.
-
On the Global networks page, choose the global network ID.
In the navigation pane, choose Core network.
The Overview page opens by default.
-
Choose the Monitoring tab.
-
From the Core network edge list, choose the core network edge that you want to monitor.
-
(Optional) Metrics and events use the default time set up in the CloudWatch Events event. To set a custom time frame, choose Custom and then choose a Relative or Absolute time, and then choose if you want to see that date range in UTC or the edge location's Local time zone.
Choose Add to dashboard to add this metric to your CloudWatch dashboard. For more information about using CloudWatch dashboards, see Using Amazon CloudWatch Dashboards in the Amazon CloudWatch User Guide.
Note
The Add to dashboard option only works if your registered transit gateway is in the US West (Oregon) Region.
-
The page updates the following monitors:
-
Bytes in
-
Bytes out
-
Bytes dropped – black hole
-
Bytes dropped – no route
-
Packets in
-
Packets out
-
Packets dropped – black hole
-
Packets dropped – no route
-
