End of support notice: On October 30, 2026, AWS will end support for Amazon Pinpoint. After October 30, 2026, you will no longer be able to access the Amazon Pinpoint console or Amazon Pinpoint resources (endpoints, segments, campaigns, journeys, and analytics). For more information, see Amazon Pinpoint end of support. Note: APIs related to SMS, voice, mobile push, OTP, and phone number validate are not impacted by this change and are supported by AWS End User Messaging.
Creating funnel charts with Amazon Pinpoint
You can use Amazon Pinpoint to analyze funnels, which are charts that show how many users complete each of a series of steps. For example, the series of steps in a funnel can be a conversion process that results in a purchase (as in a shopping cart), or some other intended user behavior.
By monitoring funnels, you can assess whether conversion rates have improved because of changes to your app or because of an Amazon Pinpoint campaign.
After you specify which steps belong in your funnel, the Create a funnel page displays a chart like the following example:
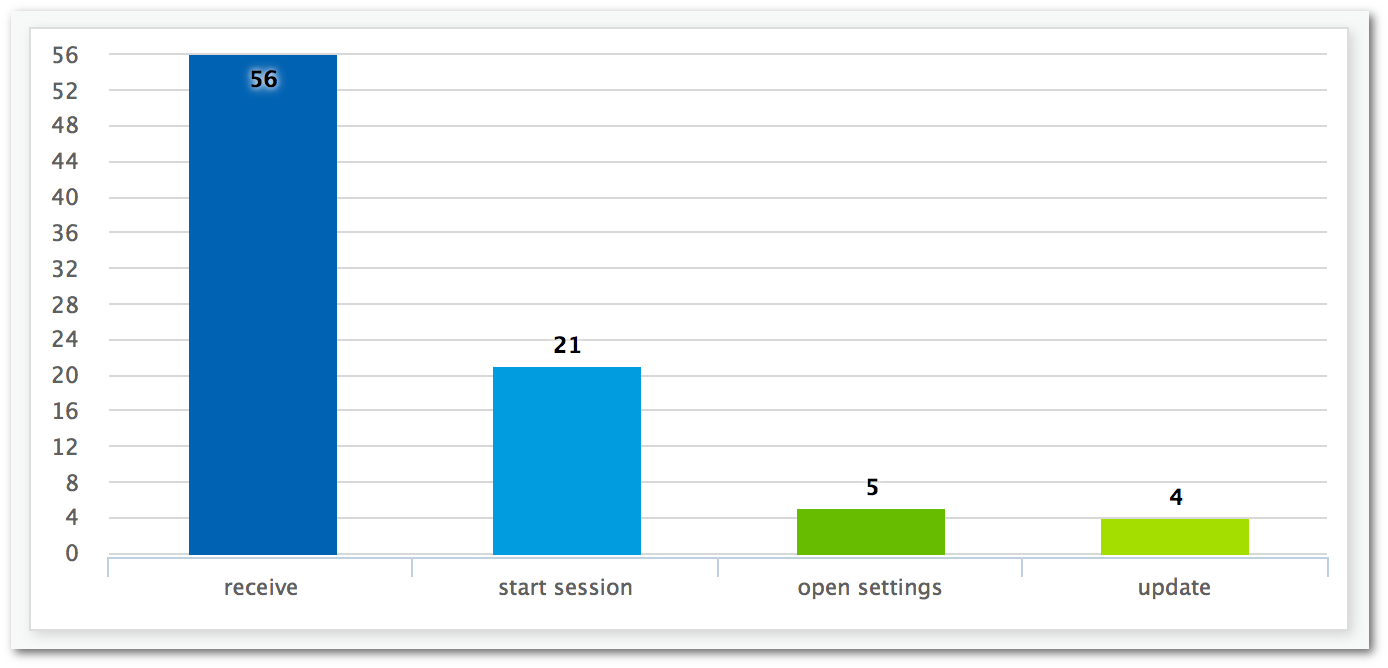
This example chart shows the percentage of users who completed each step in the process of updating an app. By comparing the values between columns, you can determine the drop-off rates between steps. In this example, there is a 35 percent drop-off between users who receive a notification and those who start an app session. Then there is a 19 percent drop-off between users who start a session and those who open the app settings page.
To create a funnel, you specify each event that's part of the conversion process that you want to analyze. When you add events to your funnel, you can choose any event that's reported by your app. Your app can report the following types of events:
-
Standard events – These include events that automatically report when an app session starts or stops. The names of event types for standard events are denoted with an underscore prefix, as in
_session.start. Standard events also include monetization events that report in-app purchases. -
Custom events – These are defined by you to monitor activities that are specific to your app. Some examples are completing a level in a game, posting to social media, or setting particular app preferences.
For information about configuring your app to report events, see Streaming events with Amazon Pinpoint.
Enabling funnels
We hide the funnels reports if you haven't used them in the past 90 days.
If the funnels page shows a message stating that the funnels reports are hidden, choose Enable funnels. When you do, we begin restoring the funnels for your account in the current AWS Region. Depending on the amount of data that's associated with your account, this process can take up to 72 hours to complete.
Creating funnels
If the funnels data for your Amazon Pinpoint account has already been loaded, you can start creating new funnels.
To create a funnel
Open the Amazon Pinpoint console at https://console.aws.amazon.com/pinpoint/
. -
On the All projects page, choose the project that you want to create a funnel for.
-
In the navigation pane, under Analytics, choose Funnels.
-
Choose Create a funnel.
-
For Funnel name, enter a name for the funnel.
-
Choose the events that you want to add to the funnel chart. For each event, specify the following:
-
Series name – A name for the event chart.
-
Event – The type of event that's reported to Amazon Pinpoint.
-
Attributes – The attribute-value pairs that are assigned to the events that you want to add to the chart.
-
-
To add more events, choose Create another series. You can also copy an event by choosing Duplicate this series.
