CloudWatch alarms and dashboards
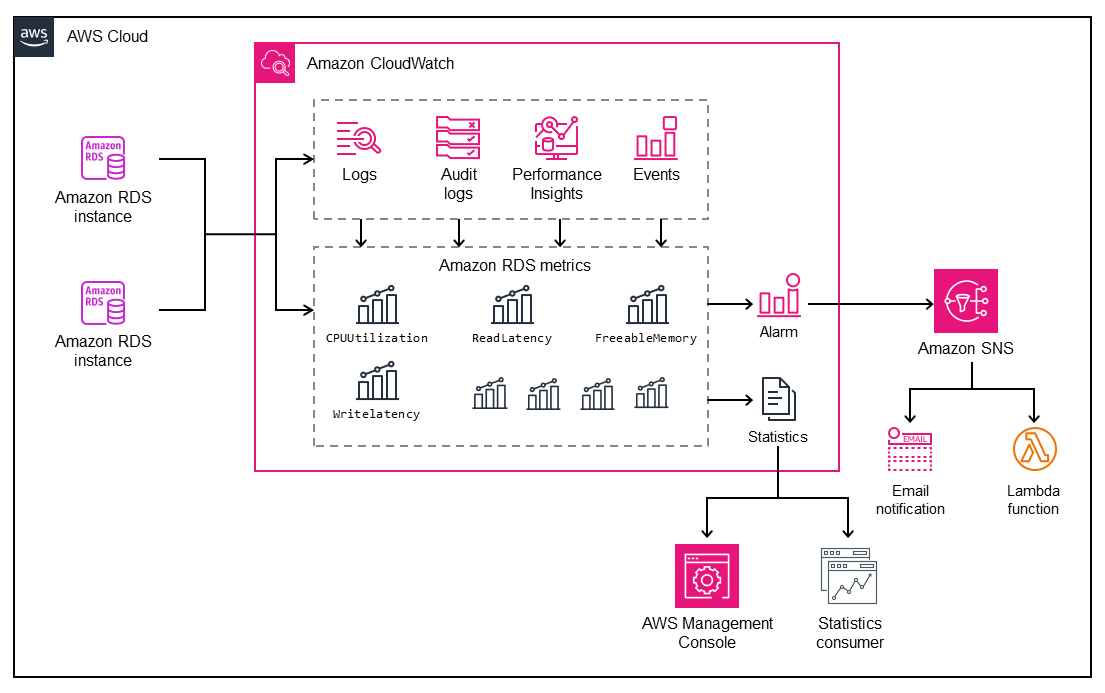
You can use Amazon CloudWatch alarms to
watch a specific Amazon RDS metric over a period of time. For example, you can monitor
FreeStorageSpace, and then perform one or more actions if the value of the
metric breaches the threshold that you set. If you set the threshold to 250 MB and the free
storage space is 200 MB (less than the threshold), the alarm will be activated and can trigger
an action to automatically provision additional storage for the Amazon RDS DB instance. The alarm
can also send a notification SMS to the DBA by using Amazon Simple Notification Service (Amazon SNS). The following
diagram illustrates this process.
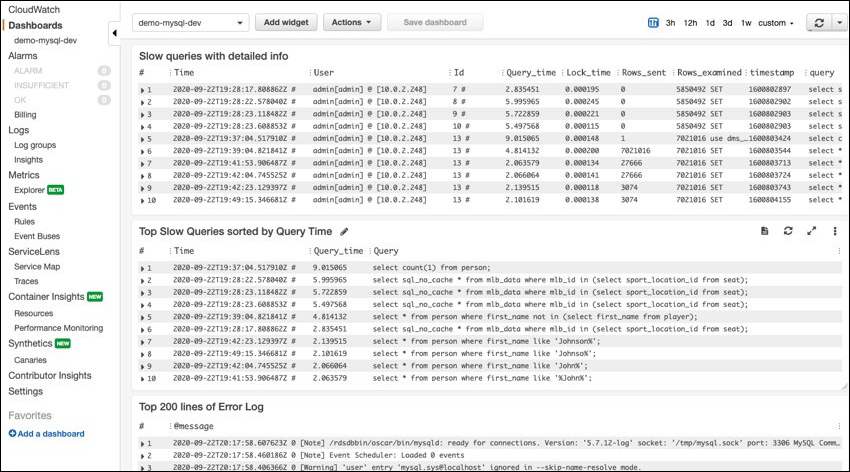
CloudWatch also provides dashboards, which you can use to create, customize, interact with, and save customized views (graphs) of the metrics. You can also use CloudWatch Logs Insights to create a dashboard for monitoring the slow query log and error log, and to receive alerts if a specific pattern has been detected in those logs. The following screen shows an example CloudWatch dashboard.