Use case: Predicting patient outcomes and re-admission rates
AI-powered predictive analytics offer further benefits by forecasting patient outcomes and enabling personalized treatment plans. This can improve patient satisfaction and health outcomes. By integrating these AI capabilities with Amazon Bedrock and other technologies, healthcare providers can achieve significant productivity gains, reduce costs, and elevate the overall quality of patient care.
You can store medical data, such as patient histories, clinical notes, medications, and
treatments, in a knowledge
graph
This solution helps you predict the likelihood of a re-admission. These predictions can improve patient outcomes and reduce healthcare costs. This solution can also help hospital clinicians and administrators focus their attention on patients with a higher risk of re-admission. It also helps them initiate proactive interventions with those patients through alerting, self-service, and data-driven actions.
Solution overview
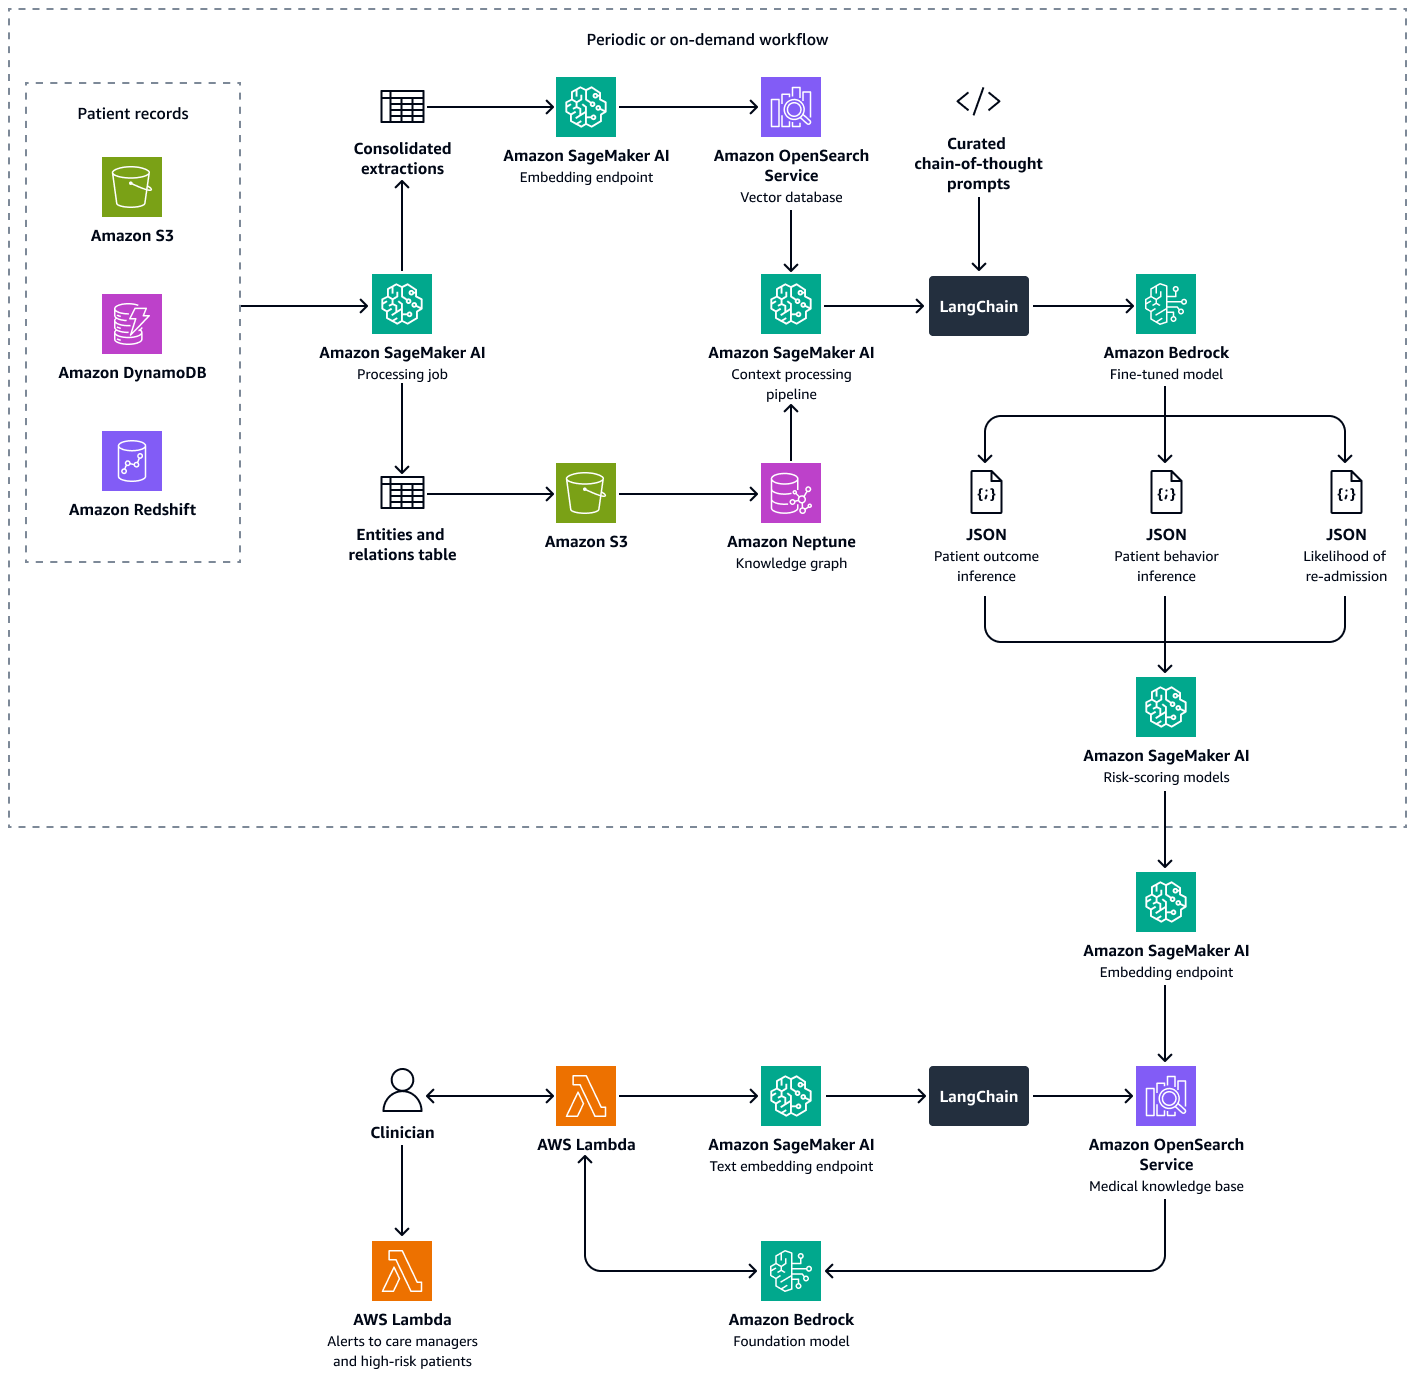
This solution uses a multi-retriever Retrieval Augmented Generation (RAG) framework to analyze patient data. It predicts the likelihood of hospital re-admission for individual patients and helps you calculate a hospital-level re-admission propensity score. This solution integrates the following features:
-
Knowledge graph – Stores structured, chronological patient data, such as hospital encounters, previous re-admissions, symptoms, lab results, prescribed treatments, and medication-adherence history
-
Vector database – Stores unstructured clinical data, such as discharge summaries, physician notes, and records of missed appointments or reported medication side effects
-
Fine-tuned LLM – Consumes both structured data from the knowledge graph and unstructured data from the vector database in order to generate inferences about a patient's behavior, treatment adherence, and re-admission likelihood
The risk-scoring models quantify the inferences from the LLM into numerical scores. You can aggregate the scores into a hospital-level re-admission propensity score. This score defines each patient's risk exposure, and you can calculate it periodically or on an as-needed basis. All inferences and risk scores are indexed and stored in Amazon OpenSearch Service so that care managers and clinicians can retrieve it. By integrating a conversational AI agent with this vector database, clinicians and care managers can seamlessly extract insights at an individual patient level, a facility-wide level, or by medical specialty. You can also set up automated alerts based on risk scores, which encourages proactive interventions.
Building this solution consists of the following steps:
Step 1: Predicting patient outcomes by using a medical knowledge graph
In Amazon Neptune, you can use a knowledge graph to store temporal knowledge about patient visits and outcomes over time. The most effective way to build and store a knowledge graph is to use a graph model and a graph database. Graph databases are purpose-built to store and navigate relationships. Graph databases make it easier to model and manage highly connected data and have flexible schemas.
The knowledge graph helps you perform time-series analysis. The following are key elements of the graph database that are used for temporal prediction of patient outcomes:
-
Historical data – Prior diagnoses, continuing medications, medications previously used, and lab results for the patient
-
Patient visits (chronological) – Visit dates, symptoms, observed allergies, clinical notes, diagnoses, procedures, treatments, prescribed medications, and lab results
-
Symptoms and clinical parameters – Clinical and symptom-based information, including severity, patterns of progression, and the patient's response to medicine
You can use the insights from the medical knowledge graph to fine-tune an LLM in Amazon Bedrock, such as Llama 3. You fine-tune the LLM with sequential patient data about the patient's response to a set of medications or treatments over time. Use a labeled dataset that classifies a set of medications or treatments and patient-clinic interaction data in to predefined categories that indicate the health status of a patient. Examples of these categories are deterioration in health, improvement, or stable progress. When the clinician inputs new context about the patient and their symptoms, the fine-tuned LLM can use the patterns from the training dataset in order to predict the potential patient outcome.
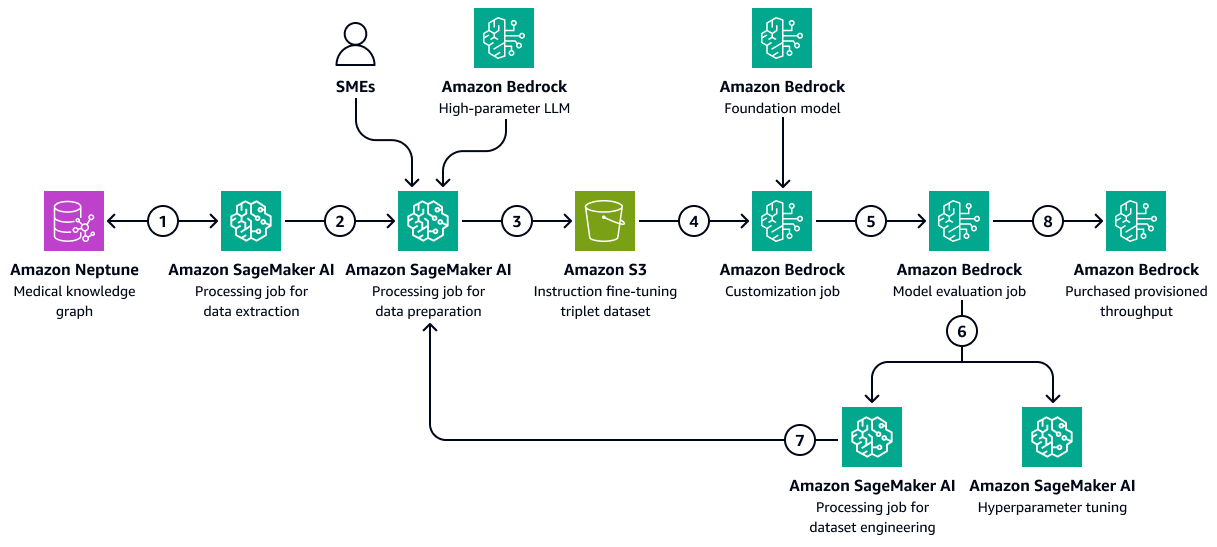
The following image shows the sequential steps involved in fine-tuning an LLM in Amazon Bedrock by using a healthcare-specific training dataset. This data might include patient medical conditions and responses to treatments over time. This training dataset would help the model to make generalized predictions about patient outcomes.
The diagram shows the following workflow:
-
The Amazon SageMaker AI data extraction job queries the knowledge graph to retrieve chronological data about different patients' responses to a set of medications or treatments over time.
-
The SageMaker AI data preparation job integrates an Amazon Bedrock LLM and inputs from subject matter experts (SMEs). The job classifies the data retrieved from the knowledge graph into predefined categories (such as deterioration in health, improvement, or stable progress) that indicate the health status of each patient.
-
The job creates a fine-tuning dataset that includes the information extracted from the knowledge graph, the chain-of-thought prompts, and the patient outcome category. It uploads this training dataset to an Amazon S3 bucket.
-
An Amazon Bedrock customization job uses this training dataset to fine-tune an LLM.
-
The Amazon Bedrock customization job integrates the Amazon Bedrock foundational model of choice within the training environment. It starts the fine-tuning job and uses the training dataset and the training hyperparameters that you configure.
-
An Amazon Bedrock evaluation job evaluates the fine-tuned model by using a pre-designed model-evaluation framework.
-
If the model needs improvement, the training job runs again with more data after careful consideration of the training dataset. If the model does not demonstrate incremental performance improvement, also consider modifying the training hyperparameters.
-
After the model evaluation meets the standards defined by the business stakeholders, you host the fine-tuned model to the Amazon Bedrock provisioned throughput.
Step 2: Predicting patient behavior towards prescribed medications or treatments
Fine-tuned LLMs can process clinical notes, discharge summaries, and other patient-specific documents from the temporal medical knowledge graph. They can assess whether the patient is likely to follow prescribed medications or treatments.
This step uses the knowledge graph created in Step 1: Predicting patient outcomes by using a medical knowledge graph. The knowledge graph contains data from the patient's profile, including the patient's historical adherence as a node. It also includes instances of non-adherence to medicines or treatments, side effects to medicines, lack of access or cost barriers to medications, or complex dosing regimens as attributes of such nodes.
Fine-tuned LLMs can consume past prescription fulfillment data from the medical knowledge graph and descriptive summaries of the clinical notes from an Amazon OpenSearch Service vector database. These clinical notes might mention frequently missed appointments or non-compliance with treatments. The LLM can use these notes to predict the likelihood of future non-adherence.
-
Prepare the input data as follows:
-
Structured data – Extract recent patient data, such as the last three visits and the lab results, from the medical knowledge graph.
-
Unstructured data – Retrieve the recent clinical notes from the Amazon OpenSearch Service vector database.
-
-
Construct an input prompt that includes patient history and current context. The following is an example prompt:
You are a highly specialized AI model trained in healthcare predictive analytics. Your task is to analyze a patient's historical medical records, adherence patterns, and clinical context to predict the **likelihood of future non-adherence** to prescribed medications or treatments. ### **Patient Details** - **Patient ID:** {patient_id} - **Age:** {age} - **Gender:** {gender} - **Medical Conditions:** {medical_conditions} - **Current Medications:** {current_medications} - **Prescribed Treatments:** {prescribed_treatments} ### **Chronological Medical History** - **Visit Dates & Symptoms:** {visit_dates_symptoms} - **Diagnoses & Procedures:** {diagnoses_procedures} - **Prescribed Medications & Treatments:** {medications_treatments} - **Past Adherence Patterns:** {historical_adherence} - **Instances of Non-Adherence:** {past_non_adherence} - **Side Effects Experienced:** {side_effects} - **Barriers to Adherence (e.g., Cost, Access, Dosing Complexity):** {barriers} ### **Patient-Specific Insights** - **Clinical Notes & Discharge Summaries:** {clinical_notes} - **Missed Appointments & Non-Compliance Patterns:** {missed_appointments} ### **Let's think Step-by-Step to predict the patient behaviour** 1. You should first analyze past adherence trends and patterns of non-adherence. 2. Identify potential barriers, such as financial constraints, medication side effects, or complex dosing regimens. 3. Thoroughly examine clinical notes and documented patient behaviors that may hint at non-adherence. 4. Correlate adherence history with prescribed treatments and patient conditions. 5. Finally predict the likelihood of non-adherence based on these contextual insights. ### **Output Format (JSON)** Return the prediction in the following structured format: ```json { "patient_id": "{patient_id}", "likelihood_of_non_adherence": "{low | moderate | high}", "reasoning": "{detailed_explanation_based_on_patient_history}" } -
Pass the prompt to the fine-tuned LLM. The LLM processes the prompt and predicts the outcome. The following is an example response from the LLM:
{ "patient_id": "P12345", "likelihood_of_non_adherence": "high", "reasoning": "The patient has a history of missed appointments, has reported side effects to previous medications. Additionally, clinical notes indicate difficulty following complex dosing schedules." } -
Parse the model's response to extract the predicted outcome category. For example, the category for the example response in the previous step might be high likelihood of non-adherence.
-
(Optional) Use model logits or additional methods to assign confidence scores. Logits are the unnormalized probabilities of the item belonging to a certain class or category.
Step 3: Predicting patient re-admission likelihood
Hospital re-admissions are a major concern due to the high cost of healthcare administration and because of their impact on the patient's well-being. Computing hospital re-admission rates is one way of measuring the quality of patient care and performance of a healthcare provider.
To compute the re-admission rate, you defined an indicator, such as a 7-day re-admission rate. This indicator is the percentage of admitted patients who return to the hospital for an unplanned visit within seven days of discharge. To predict the chance of re-admission for a patient, a fine-tuned LLM can consume temporal data from the medical knowledge graph that you created in Step 1: Predicting patient outcomes by using a medical knowledge graph. This knowledge graph maintains chronological records of patient encounters, procedures, medications, and symptoms. These data records contain the following:
-
Duration of time since the patient's last discharge
-
The patient's response to past treatments and medications
-
The progression of symptoms or conditions over time
You can process these time-series events to predict the re-admission likelihood of a patient through a curated system prompt. The prompt imparts the prediction logic to the fine-tuned LLM.
-
Prepare the input data as follows:
-
Adherence history – Extract medication pickup dates, medication refill frequencies, diagnosis and medication details, chronological medical history, and other information from the medical knowledge graph.
-
Behavioral indicators – Retrieve and include clinical notes about missed appointments and patient-reported side effects.
-
-
Construct an input prompt that includes the adherence history and behavioral indicators. The following is an example prompt:
You are a highly specialized AI model trained in healthcare predictive analytics. Your task is to analyze a patient's historical medical records, clinical events, and adherence patterns to predict the **likelihood of hospital readmission** within the next few days. ### **Patient Details** - **Patient ID:** {patient_id} - **Age:** {age} - **Gender:** {gender} - **Primary Diagnoses:** {diagnoses} - **Current Medications:** {current_medications} - **Prescribed Treatments:** {prescribed_treatments} ### **Chronological Medical History** - **Recent Hospital Encounters:** {encounters} - **Time Since Last Discharge:** {time_since_last_discharge} - **Previous Readmissions:** {past_readmissions} - **Recent Lab Results & Vital Signs:** {recent_lab_results} - **Procedures Performed:** {procedures_performed} - **Prescribed Medications & Treatments:** {medications_treatments} - **Past Adherence Patterns:** {historical_adherence} - **Instances of Non-Adherence:** {past_non_adherence} ### **Patient-Specific Insights** - **Clinical Notes & Discharge Summaries:** {clinical_notes} - **Missed Appointments & Non-Compliance Patterns:** {missed_appointments} - **Patient-Reported Side Effects & Complications:** {side_effects} ### **Reasoning Process – You have to analyze this use case step-by-step.** 1. First assess **time since last discharge** and whether recent hospital encounters suggest a pattern of frequent readmissions. 2. Second examine **recent lab results, vital signs, and procedures performed** to identify clinical deterioration. 3. Third analyze **adherence history**, checking if past non-adherence to medications or treatments correlates with readmissions. 4. Then identify **missed appointments, self-reported side effects, or symptoms worsening** from clinical notes. 5. Finally predict the **likelihood of readmission** based on these contextual insights. ### **Output Format (JSON)** Return the prediction in the following structured format: ```json { "patient_id": "{patient_id}", "likelihood_of_readmission": "{low | moderate | high}", "reasoning": "{detailed_explanation_based_on_patient_history}" } -
Pass the prompt to the fine-tuned LLM. The LLM processes the prompt and predicts the re-admission likelihood and reasons. The following is an example response from the LLM:
{ "patient_id": "P67890", "likelihood_of_readmission": "high", "reasoning": "The patient was discharged only 5 days ago, has a history of more than two readmissions to hospitals where the patient received treatment. Recent lab results indicate abnormal kidney function and high liver enzymes. These factors suggest a medium risk of readmission." } -
Categorize the prediction into a standardized scale, such as low, medium, or high.
-
Review the reasoning provided by the LLM, and identify key factors that contribute to the prediction.
-
Map the qualitative outputs to quantitative scores. For example, very high might equal a 0.9 probability.
-
Use validation datasets to calibrate the model outputs against actual re-admission rates.
Step 4: Computing the hospital re-admission propensity score
Next, you calculate a hospital re-admission propensity score per patient. This score reflects the net impact of the three analyses performed in the previous steps: potential patient outcomes, patient behavior towards medications and treatments, and patient re-admission likelihood. By aggregating the patient-level re-admission propensity score to specialty level and then at hospital level, you can gain insights to clinicians, care managers, and administrators. The hospital re-admission propensity score helps you assess overall performance by facility, by specialty, or by condition. Then, you can use this score to implement proactive interventions.
-
Assign weights to each of the different factors (outcome prediction, adherence likelihood, re-admission). The following are example weights:
-
Outcome Prediction Weight: 0.4
-
Adherence Prediction Weight: 0.3
-
Re-admission Likelihood Weight: 0.3
-
-
Use the following calculation to calculate the composite score:
ReadadmissionPropensityScore= (OutcomeScore×OutcomeWeight) + (AdherenceScore×AdherenceWeight) + (ReadmissionLikelihoodScore×ReadmissionLikelihoodWeight) -
Make sure that all individual scores are on the same scale, such as 0 to 1.
-
Define the thresholds for action. For example, scores above 0.7 initiate alerts.
Based on the above analyses and re-admission propensity score of a patient, clinicians or care managers can set up alerts to monitor their individual patients based on the computed score. If it is above a pre-defined threshold, they are notified when that threshold is reached. This helps care managers to be proactive rather than reactive when creating discharge care plans for their patients. Save the patient outcome, behavior, and re-admission propensity scores in an indexed form in an Amazon OpenSearch Service vector database so that care managers can seamlessly retrieve them by using a conversational AI agent.
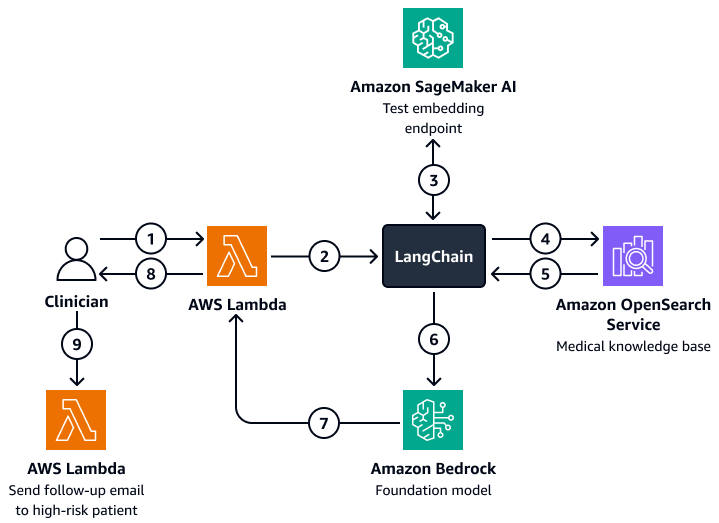
The following diagram shows the workflow of a conversational AI agent that a clinician or care manager can use to retrieve insights on patient outcomes, expected behavior, and re-admission propensity. Users can retrieve insights at the patient-level, department-level, or hospital-level. The AI agent retrieves these insights, which are stored in an indexed form in an Amazon OpenSearch Service vector database. The agent uses the query to retrieve relevant data and provides tailored responses, including suggested actions for patients who have a high risk of re-admission. Based on the level of risk, the agent can also set up reminders for patients and care givers.
The diagram shows the following workflow:
-
The clinician poses a question to a conversational AI agent, which houses an AWS Lambda function.
-
The Lambda function initiates a LangChain agent.
-
The LangChain agent sends the user's question to an Amazon SageMaker AI text embedding endpoint. The endpoint embeds the question.
-
The LangChain agent passes embedded question to a medical knowledge base in Amazon OpenSearch Service.
-
Amazon OpenSearch Service returns the specific insights that are most relevant to the user query to the LangChain agent.
-
The LangChain agents sends the query and the retrieved context from the knowledge base to an Amazon Bedrock foundation model.
-
The Amazon Bedrock foundation model generates a response and sends it to the Lambda function.
-
The Lambda function returns the response to the clinician.
-
The clinician initiates a Lambda function that sends a follow-email to a patient who has a high risk of re-admission.
Alignment to the AWS Well-Architected Framework
The architecture for tracking patient behavior and predicting hospital re-admission rates
integrates AWS services, medical knowledge graphs, and LLMs to improve healthcare outcomes
while aligning with the six pillars of the AWS Well-Architected Framework
-
Operational excellence – The solution is a decoupled, automated system that uses Amazon Bedrock and AWS Lambda for real-time alerts.
-
Security – This solution is designed to comply with healthcare regulations, such as HIPAA. You can also implement encryption, fine-grained access control, and Amazon Bedrock guardrails to help protect patient data.
-
Reliability – The architecture uses fault-tolerant, serverless AWS services.
-
Performance efficiency – Amazon OpenSearch Service and the fine-tuned LLMs can provide fast and accurate predictions.
-
Cost optimization – Serverless technologies and pay-per-inference models help minimize costs. Although a using fine-tuned LLM can incur extra charges, the model uses a RAG approach that reduces the data and computational time required for the fine-tuning process.
-
Sustainability – The architecture minimizes resource consumption through the use of serverless infrastructure. It also supports efficient, scalable healthcare operations.
