Asking questions with Amazon QuickSight Q - Amazon QuickSight

Important: We've redesigned the Amazon QuickSight analysis workspace. You might encounter screenshots or procedural text that doesn't reflect the new look in the QuickSight console. We're in the process of updating screenshots and procedural text.

To find a feature or item, use the Quick search bar.

For more information on QuickSight's new look, see Introducing new analysis experience on Amazon QuickSight.

Asking questions with Amazon QuickSight Q

 Applies to: Enterprise Edition 

   Intended audience: Amazon QuickSight Dashboard subscribers or viewership 

Use the following procedure to ask a question in the Q bar.

To ask a question in the Q bar
  1. In the Q bar at the top of any QuickSight page, choose the topic list at left, and then choose the topic that you want to ask questions about.

    
                        Image of the topics list in the Q bar.

    If you're not sure what a topic is about, hover your cursor over the topic name to read a description about it.

  2. Enter a question in the Q bar and then press enter on your keyboard.

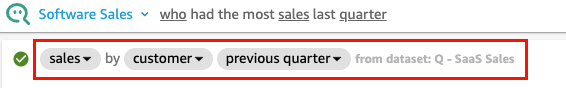
    Q presents an answer to your question as a visual.

    
                        Animated image of asking a question in the Q bar.

    You can see how Q interpreted your question in the description at the visual's upper left. Here you can see the fields, aggregations, and datasets used to answer the question.

    
                        Image of the answer description.
  3. (Optional) Change the visual type by choosing the visual types icon at right, and then choosing a visual type.

    
                        Animated image of changing the chart type of a Q answer.
  4. (Optional) See key data insights and callouts by choosing the lightbulb icon at right. Insights appear in the pane that opens at right.

    
                        Animated image of showing insights.
  5. (Optional) Add a forecast by choosing the lightbulb icon at right, and then turning on Forecast. Choose the settings gear icon that appears at right and use the slider to adjust the forecast timeline.

    Note

    Forecasting is only available for answers that contain line charts with a single time series.

    
                        Animated image of showing a forecast in a Q answer.
  6. (Optional) Undo or redo any changes you make to the answer by choosing the undo or redo arrows in the Q search bar.

    
                        Animated image of showing a forecast in a Q answer.
  7. (Optional) Use the About topic menu to see the topic's name, description, key details, commonly asked questions, and attributes. Choose the info icon that appears at right to access the About topic menu.

    
                        Animated image of showing the About topic menu.

Sometimes Q might not interpret your question the way you wanted. When this happens, you can provide feedback on the answer or make suggestions for corrections to the answer. For more information about providing answer feedback, see Providing feedback about Amazon QuickSight Q topics. For more information about correcting answers, see Correcting wrong answers provided by Amazon QuickSight Q.

Types of questions supported by Q

When asking questions in the Q bar, we recommend phrasing them similarly to the following question types.

Question Type Example

Dimensional Group Bys

Revenue by product

Dimensional Filters (Include)

Sales for company

Date Group Bys

What is the weekly/monthly revenue trend?

Multi Metrics

What is actual revenue compared to goal?

KPI-Based Period over Periods (PoPs)

What is the revenue difference WoW?

Relative Date Filters

Show me revenue trend for the last 12 weeks

Date Aggregation

Show me revenue by quarter

Time Range Filters

How many new users do we have since Jan 2020?

Top/Bottom Filter

Top 10 customers by regional sales last week

Period to Date (PtD) and Period over Period (PoP)

Growth % in revenue YTD vs last year in California

Non-KPI-Based Table Calculations

Product with largest WoW growth %

Sort Order

Products with most revenue last week

Aggregate Metrics Filter

Customers who spent more than $1M last month

List Questions

Show me all opportunities created last month

OR filters

Show me defect that are open OR older than 3 months

Percent of Total

What is % of total revenue by product in 2018?

Where Questions

Where did we have the most sales in 2020?

When Questions

When did we have more than 50,000 in sales per week?

Who Questions

Who made the most sales last month?

Exclude Questions

Show me weekly sales excluding New York

Boolean Questions

Show me the count of open tickets

Forecasting Questions

Show me a forecast of sales for energy customers

Why Questions

Why did enrollment drop in 2021?