Working with paginated reports in Amazon QuickSight
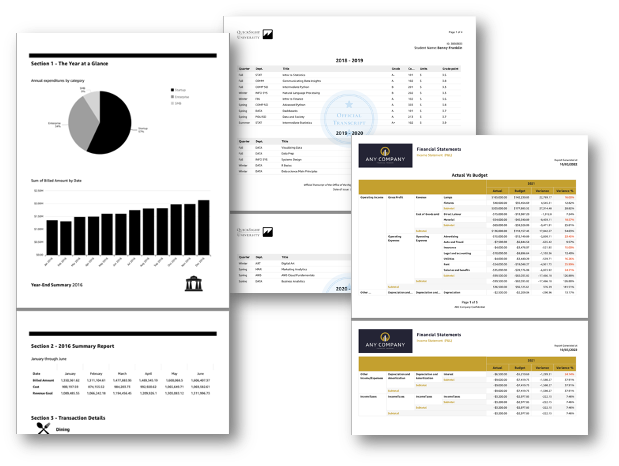
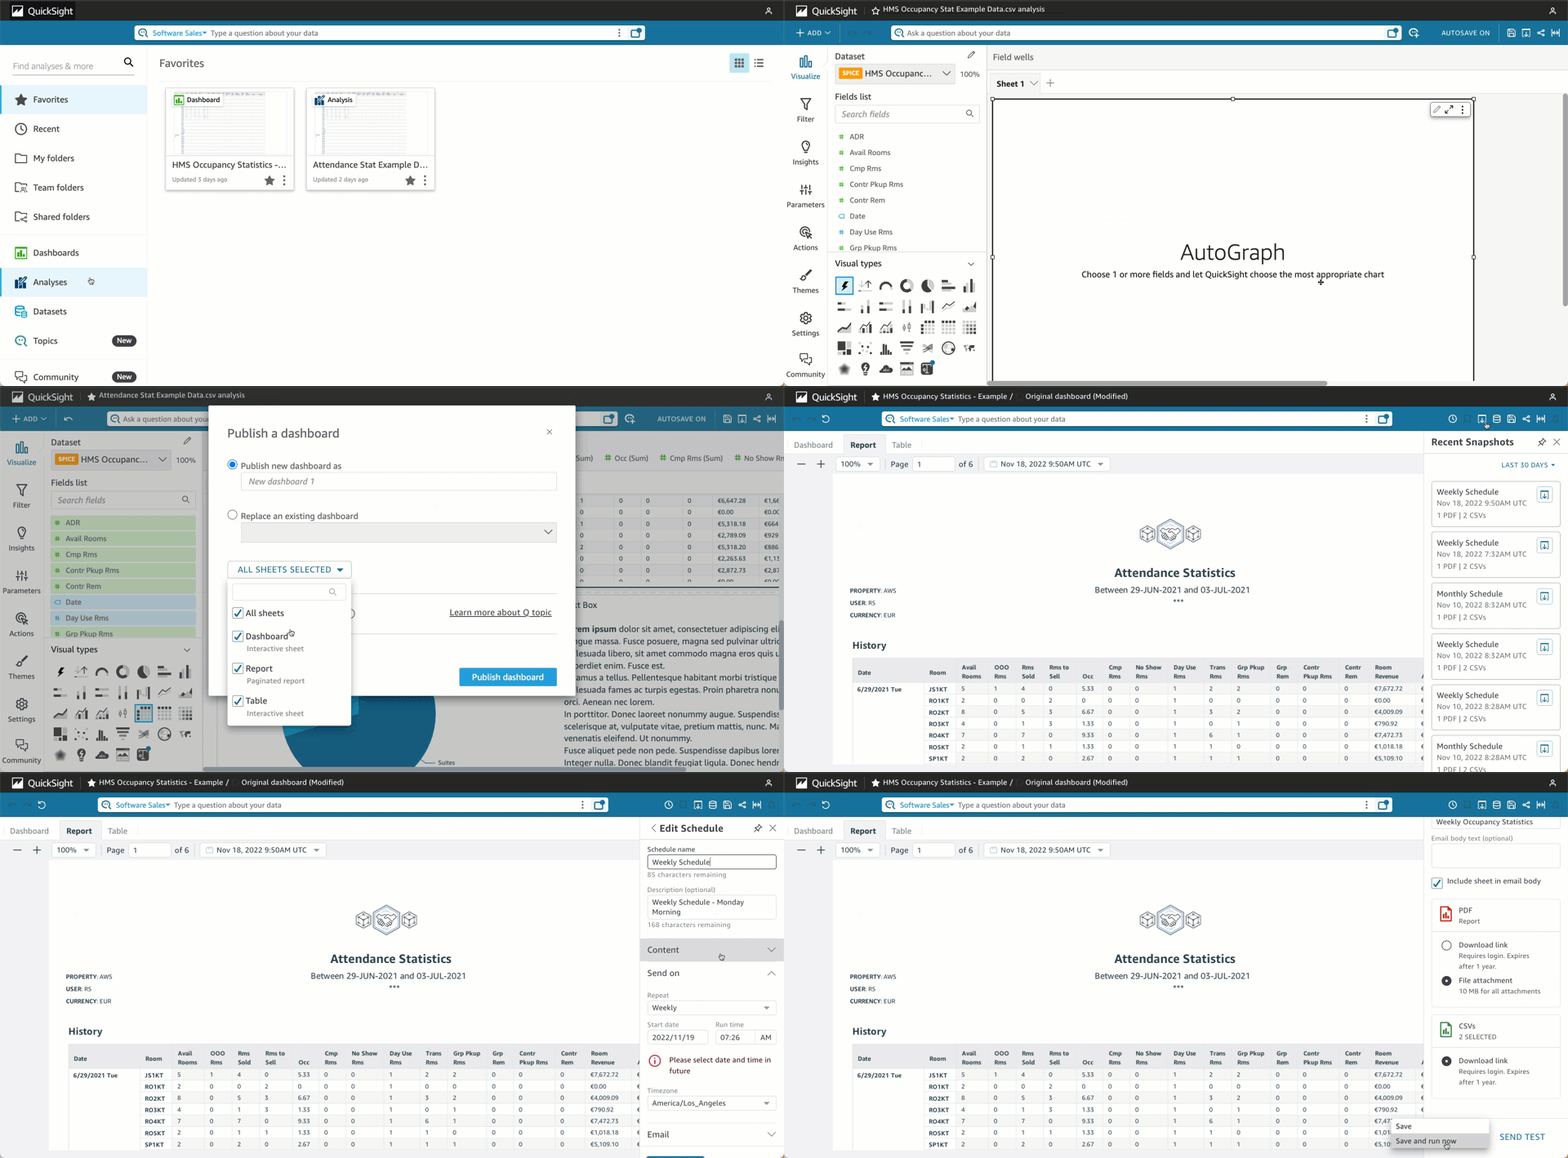
With Amazon QuickSight Paginated Reports, you can create, schedule, and share highly formatted multipage PDF reports. You can also schedule data exports as CSV files using QuickSight's existing web interface. This unifies historically separate systems for dashboards and reports.

Report creators can use QuickSight's browser-based authoring experience to connect to a broad range of supported data sources and create highly formatted reports. They can specify the exact page size, length, and arrangement of images, charts, and tables with pixel-level precision. Authors can then use QuickSight's scheduling mechanisms to set up and schedule highly personalized report delivery to end users, or archive reports for future use.
Paginated reports are designed to be printed or distributed. Paginated report content is formatted to fit paper sizes and it displays all the data in a table and pivot table, even if the data spans multiple pages. Paginated reports are also referred to as pixel perfect because they are formatted for exact paper sizes and you can control page layout exactly. Each paginated report can generate a PDF of up to 1,000 pages.
Paginated reports provide all available data that is present when the report is published as a PDF or CSV. For example, let's say you have a table with 10,000 rows. A paginated report presents the entire report across multiple pages for readers to view in its entirety. If you include this same table in an interactive dashboard report, the generated PDF includes a snapshot of the table that fills in a single page that can be scrolled through. These customized reports can be sent out in email bursts that generate up to thousands of personalized PDF or CSV reports to individual users and groups.
Note
Paginated reports are not available in the eu-central-2 Europe (Zurich) region.
