Amazon Redshift will no longer support the creation of new Python UDFs starting November 1, 2025.
If you would like to use Python UDFs, create the UDFs prior to that date.
Existing Python UDFs will continue to function as normal. For more information, see the
blog post
Viewing query history data
You can use query history metrics in Amazon Redshift to do the following:
-
Isolate and diagnose query performance problems.
-
Compare query runtime metrics and cluster performance metrics on the same timeline to see how the two might be related. Doing so helps identify poorly performing queries, look for bottleneck queries, and determine if you need to resize your cluster for your workload.
-
Drill down to the details of a specific query by choosing it in the timeline. When Query ID and other properties are displayed in a row below the graph, then you can choose the query to see query details. Details include, for example, the query's SQL statement, execution details, and query plan. For more information, see Viewing and analyzing query details.
-
Determine if your load jobs complete successfully and meet your service level agreements (SLAs).
To display query history data
-
Sign in to the AWS Management Console and open the Amazon Redshift console at https://console.aws.amazon.com/redshiftv2/
. -
On the navigation menu, choose Clusters, then choose the cluster name from the list to open its details. The details of the cluster are displayed, which can include Cluster performance, Query monitoring, Databases, Datashares, Schedules, Maintenance, and Properties tabs.
-
Choose the Query monitoring tab for metrics about your queries.
-
In the Query monitoring section, choose the Query history tab.
Using controls on the window, you can toggle between Query list and Cluster metrics.
When you choose Query list, the tab includes the following graphs:
-
Query runtime – The query activity on a timeline. Use this graph to see which queries are running in the same timeframe. Choose a query to view more query execution details. The x-axis shows the selected period. You can filter the graphed queries by running, completed, loads, and so on. Each bar represents a query, and the length of the bar represents its runtime from the start of the bar to the end. The queries can include SQL data manipulation statements (such as SELECT, INSERT, DELETE) and loads (such as COPY). By default, the top 100 longest running queries are shown for the selected time period.
-
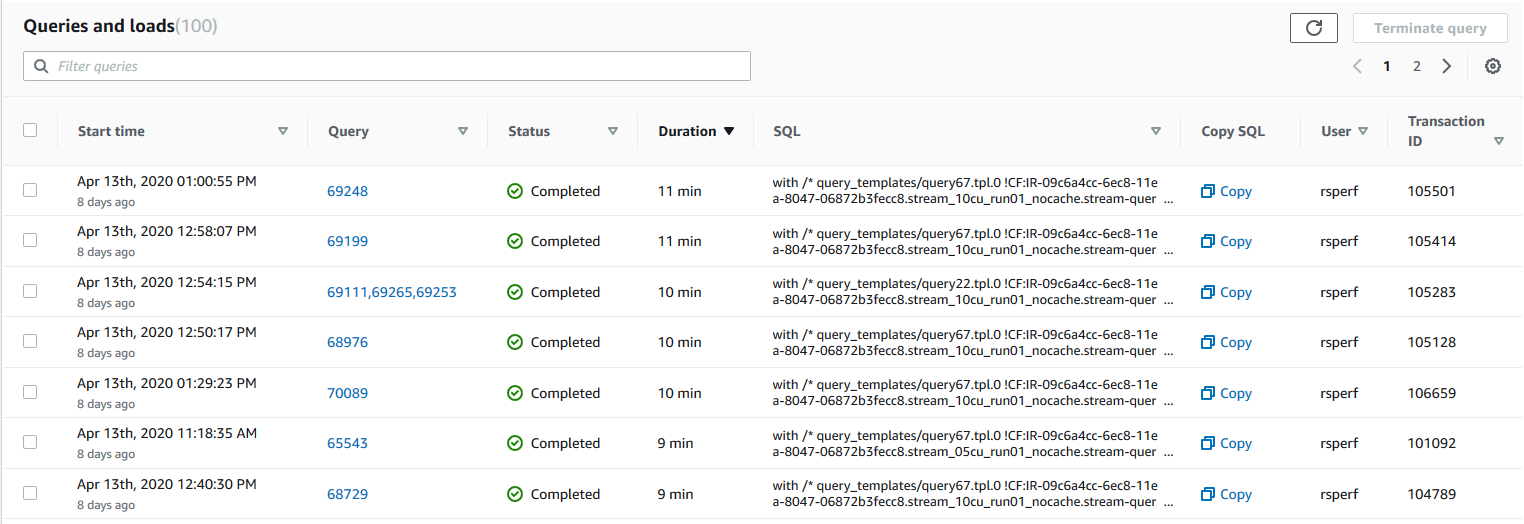
Queries and loads – List of queries and loads that ran on the cluster. The window includes an option to Terminate query if a query is currently running.
When you choose Cluster metrics, the tab includes the following graphs:
-
Query runtime – The query activity on a timeline. Use this graph to see which queries are running in the same timeframe. Choose a query to view more query execution details.
-
CPU utilization – The CPU utilization of the cluster by leader node and average of compute nodes.
-
Storage capacity used – The percent of the storage capacity used.
-
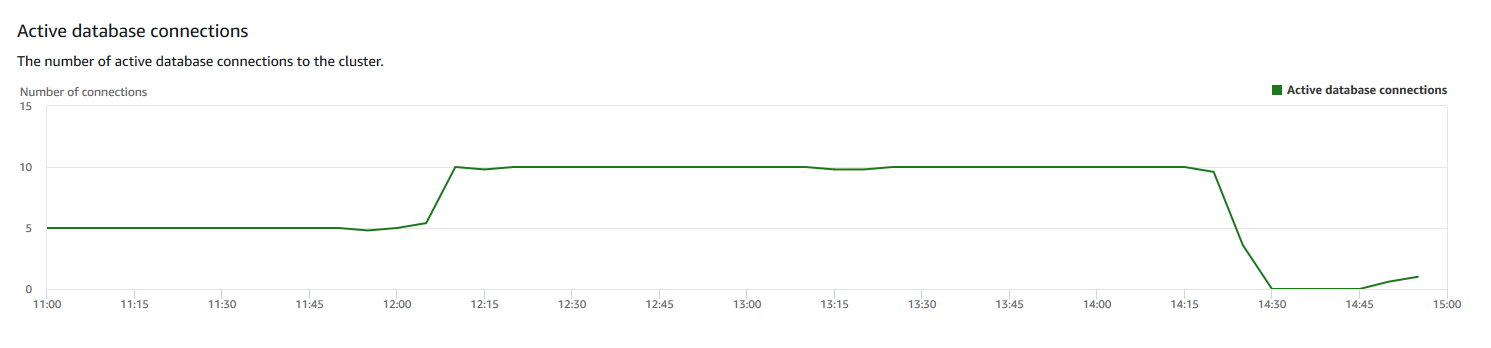
Active database connections – The number of active database connections to the cluster.
-
Consider the following when working with the query history graphs:
-
Choose a bar that represents a specific query on the Query runtime chart to see details about that query. You can also, choose a query ID on Queries and loads list to see its details.
-
You can swipe to select a section of the Query runtime chart to zoom in to display a specific time period.
-
On the Query runtime chart, to have all data considered by your chosen filter, page forward through all pages listed on the Queries and loads list.
-
You can change which columns and the number of rows displayed on the Queries and loads list using the preferences window displayed by the settings gear icon.
-
The Queries and loads list can also be displayed by navigating from the left navigator Queries icon, Queries and loads. For more information, see Viewing queries and loads.
Query history graphs
The following examples show graphs that are displayed in the new Amazon Redshift console.
Note
The Amazon Redshift console graphs only contain data for the latest 100,000 queries.
-
Query runtime

-
Queries and loads
-
CPU utilization

-
Storage capacity used

-
Active database connections