Build monitoring dashboard
AWS recommends that you configure a custom baseline monitoring system for each critical endpoint. For information on creating and using customized metric views, refer to CloudWatch Dashboards - Create & Use Customized Metrics Views
The following dashboard screenshot shows an example of a custom baseline monitoring system.
Screenshot of CloudFront dashboard
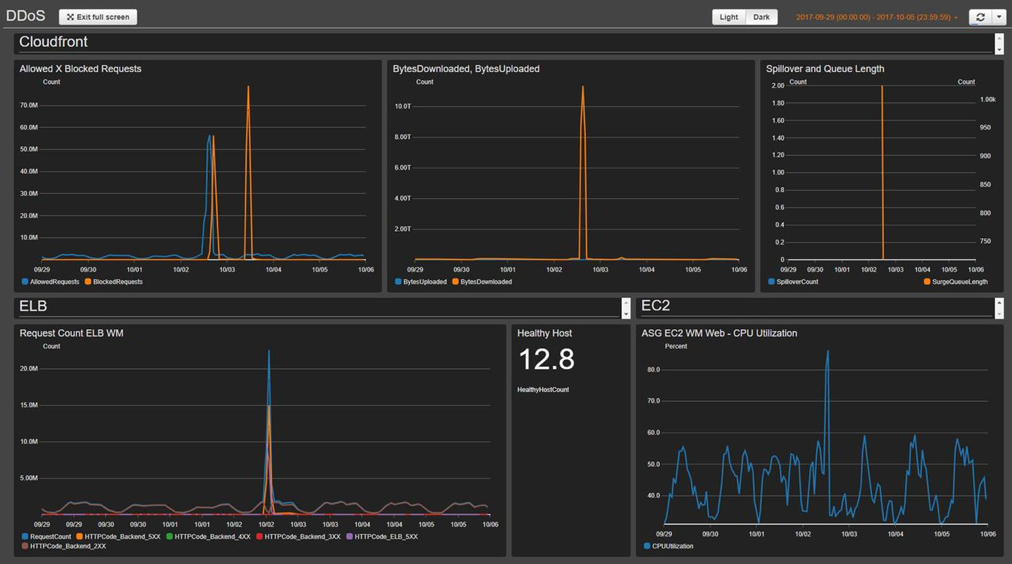
The dashboard displays the following metrics:
-
Allowed vs Blocked Requests - Shows if you receive a surge in allowed access (twice the normal peak access) or blocked access (any period that identifies more than 1K blocked requests). CloudWatch sends an alert to a Slack channel. You can use this metric to track known DDoS attacks (when blocked requests increase) or a new version of an attack (when the requests are allowed to access the system).
Note
Note: The solution provides this metric.
-
BytesDownloaded vs Uploaded - Helps identify when a DDoS attack targets a service that normally doesn’t receive a large amount of access to exhaust resources (for example, search engine component sending MBs of information for one specific request parameters set).
-
ELB Spillover and Queue length - Helps verify if a DDoS attack is causing damage to the infrastructure and the attacker is bypassing CloudFront or the AWS WAF layer, and attacking directly unprotected resources.
-
ELB Request Count - Helps identify damage to the infrastructure. This metric shows if the attacker is bypassing the protection layer, or if you should review a CloudFront cache rule to increase the cache hit rate.
-
ELB Healthy Host - You can use this as another system health check metric.
-
ASG CPU Utilization - Helps identify if the attacker is bypassing CloudFront, AWS WAF, and Elastic Load Balancing. You can also use this metric to identify the damage of an attack.
