本文属于机器翻译版本。若本译文内容与英语原文存在差异,则一律以英文原文为准。
教程:创建 Amazon QuickSight 分析
在下面的简短教程中,您将创建分析,使用添加视觉对象 AutoGraph,并通过选择特定的视觉对象类型来添加其他视觉对象。该步骤以您在 教程:创建准备好的 Amazon QuickSight 数据集 中创建和准备的数据集为基础。
创建您的分析
使用以下步骤创建您的分析。
创建您的分析
-
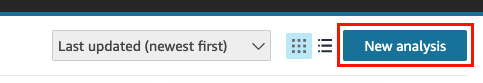
在 Amazon QuickSight 起始页上,选择 “新建分析”。
-
在数据集页面上,选择商业评论示例数据集,然后选择创建分析。
使用创建视觉效果 AutoGraph
使用创建视觉对象 AutoGraph,默认情况下处于选中状态。
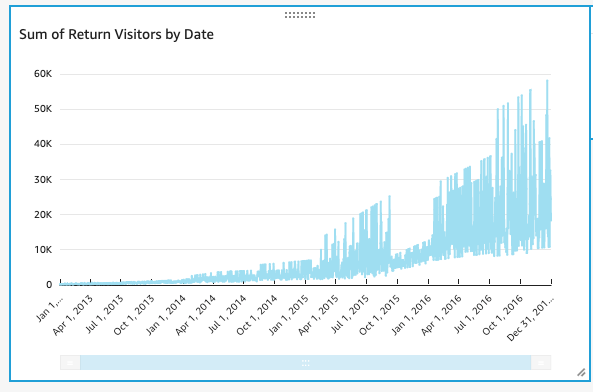
在分析页面上,选择 Fields list 窗格中的 Date 和 Return visitors。
Amazon 使用这些数据 QuickSight 创建折线图。
创建散点图视觉对象
通过选择视觉对象类型并将字段拖放到字段井,来创建一个视觉对象。
创建散点图视觉对象
-
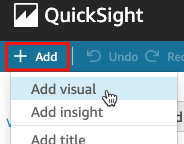
在分析页面上,选择应用程序栏上的 Add,然后选择 Add visual。系统会创建一个新的空白视觉对象,并且默认 AutoGraph 处于选中状态。
-
在 Visual types 窗格中,选择散点图图标。

-
选择字段列表窗格中的字段,以添加到字段井窗格:
-
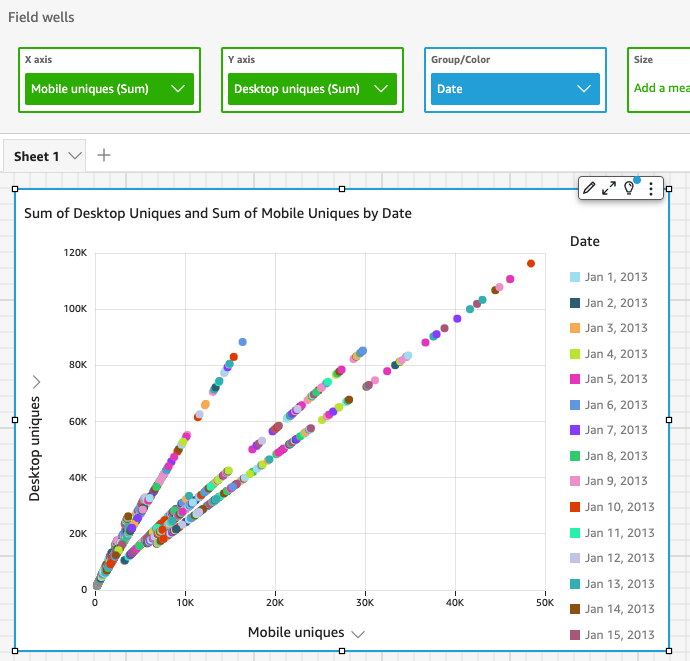
选择 Desktop Uniques 填充 X axis 字段井。
-
选择 Mobile Uniques 填充 Y axis 字段井。
-
选择 Date 填充 Group/Color 字段井。
将使用这些字段创建一个散点图。
-
后续步骤
使用 教程:修改 Amazon QuickSight 视觉效果 中的步骤修改您的分析中的视觉对象。
