本文為英文版的機器翻譯版本,如內容有任何歧義或不一致之處,概以英文版為準。
Amazon OpenSearch Service 的追蹤分析
您可以使用屬於 OpenSearch 可觀測性外掛程式一部分的 Trace Analytics,分析來自分散式應用程式的追蹤資料。Trace Analytics 需要 OpenSearch 或 Elasticsearch 7.9 或更高版本。
在分散式應用程式中,單一操作 (例如使用者按一下按鈕) 可觸發一系列延伸事件。例如,應用程式前端可能會呼叫後端服務,這會呼叫另一個服務,查詢資料庫,處理查詢並傳回結果。然後,第一個後端服務會將確認傳送到前端,以便更新 UI。
您可以使用 Trace Analytics 來協助您將此事件流程視覺化並發現效能問題。
注意
本文件提供 Trace Analytics 的簡短概觀。如需完整文件,請參閱開放原始碼 OpenSearch 文件中的追蹤分析
先決條件
Trace Analytics 需要您將檢測
在您將檢測新增到應用程式之後,OpenTelemetry Collector
最後,您可以使用 Amazon OpenSearch 擷取概觀 來格式化 OpenTelemetry 資料,以便與 OpenSearch 搭配使用。
OpenTelemetry Collector 範例組態
若要搭配 使用 OpenTelemetry CollectorAmazon OpenSearch 擷取概觀,請嘗試下列範例組態:
extensions:
  sigv4auth:
    region: "us-east-1"
    service: "osis"

receivers:
  jaeger:
    protocols:
      grpc:

exporters:
  otlphttp:
    traces_endpoint: "https://pipeline-endpoint.us-east-1.osis.amazonaws.com/opentelemetry.proto.collector.trace.v1.TraceService/Export"
    auth:
      authenticator: sigv4auth
    compression: none

service:
  extensions: [sigv4auth]
  pipelines:
    traces:
      receivers: [jaeger]
      exporters: [otlphttp]
OpenSearch 擷取範例組態
若要將追蹤資料傳送至 OpenSearch Service 網域,請嘗試下列範例 OpenSearch Ingestion 管道組態。如需建立管道的說明,請參閱 建立 Amazon OpenSearch 擷取管道。
version: "2"
otel-trace-pipeline:
  source:
    otel_trace_source:
      "/${pipelineName}/ingest"
  processor:
    - trace_peer_forwarder:
  sink:
    - pipeline:
        name: "trace_pipeline"
    - pipeline:
        name: "service_map_pipeline"
trace-pipeline:
  source:
    pipeline:
      name: "otel-trace-pipeline"
  processor:
    - otel_traces:
  sink:
    - opensearch:
        hosts: ["https://domain-endpoint"]
        index_type: trace-analytics-raw
        aws:
          # IAM role that OpenSearch Ingestion assumes to access the domain sink
          sts_role_arn: "arn:aws:iam::{account-id}:role/pipeline-role"
          region: "us-east-1"

service-map-pipeline:
  source:
    pipeline:
      name: "otel-trace-pipeline"
  processor:
    - service_map:
  sink:
    - opensearch:
        hosts: ["https://domain-endpoint"]
        index_type: trace-analytics-service-map
        aws:
          # IAM role that the pipeline assumes to access the domain sink
          sts_role_arn: "arn:aws:iam::{account-id}:role/pipeline-role"
          region: "us-east-1"
您在 sts_role_arn選項中指定的管道角色必須具有對接收器的寫入許可。如需設定管道角色許可的說明,請參閱 在 Amazon OpenSearch Ingestion 中設定角色和使用者。
瀏覽追蹤資料
Dashboard (儀表板) 檢視會依 HTTP 方法和路徑將追蹤集中在一起,以便您可以查看與特定操作相關聯的平均延遲、錯誤率和趨勢。如需更詳細的檢視,請嘗試按照追蹤群組名稱進行篩選。

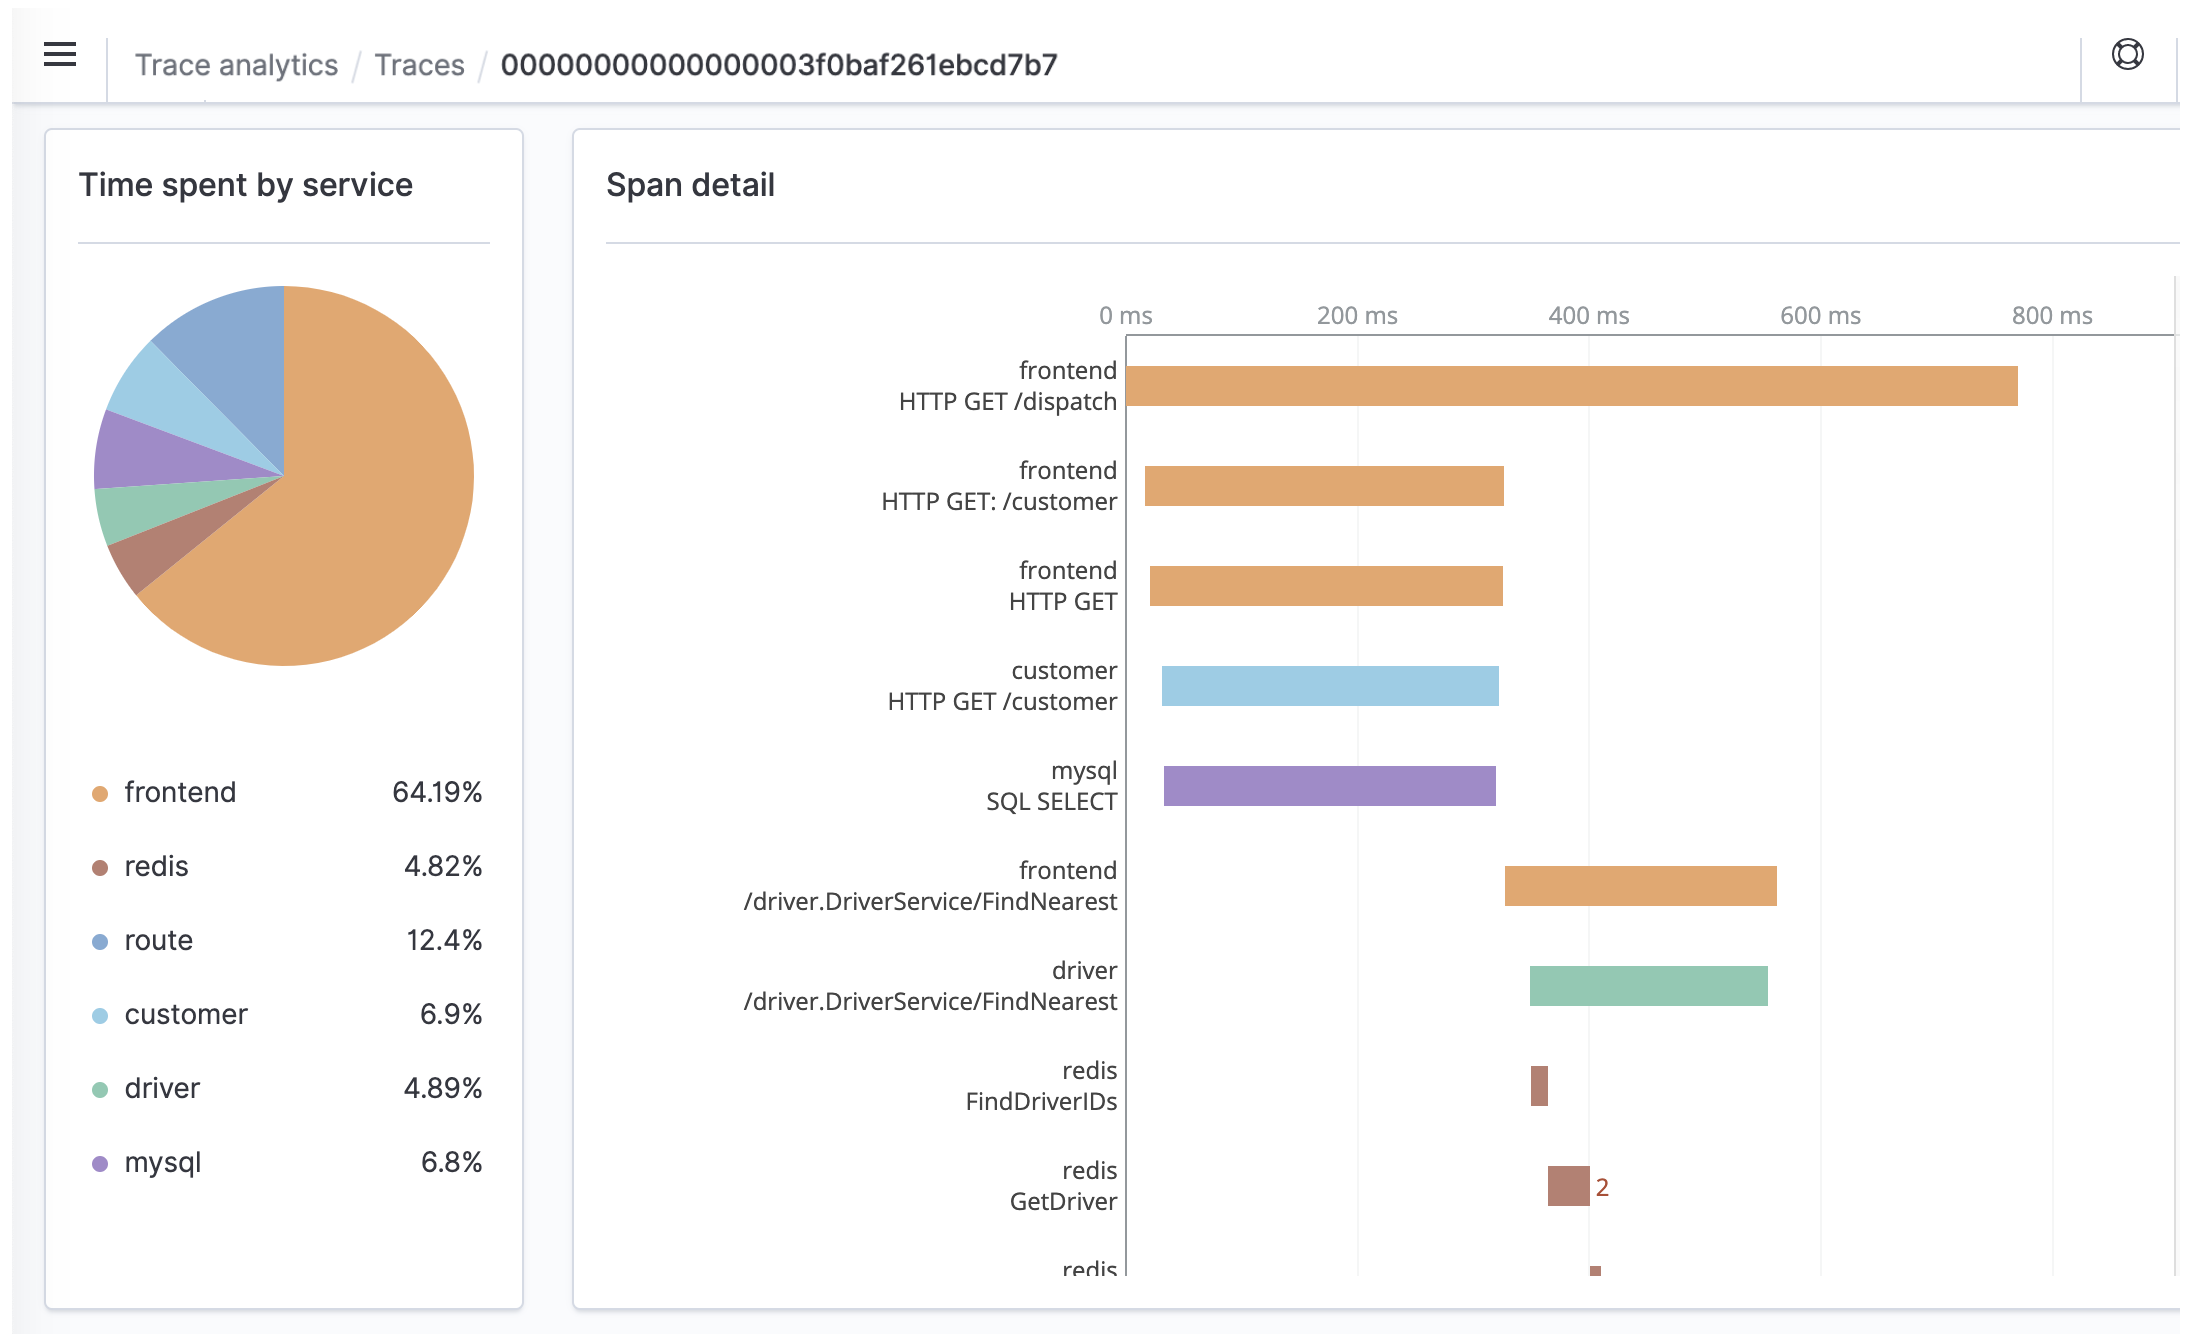
若要深入了解構成追蹤群組的追蹤,請在右欄中選擇追蹤數目。然後選擇個別追蹤以取得詳細摘要。
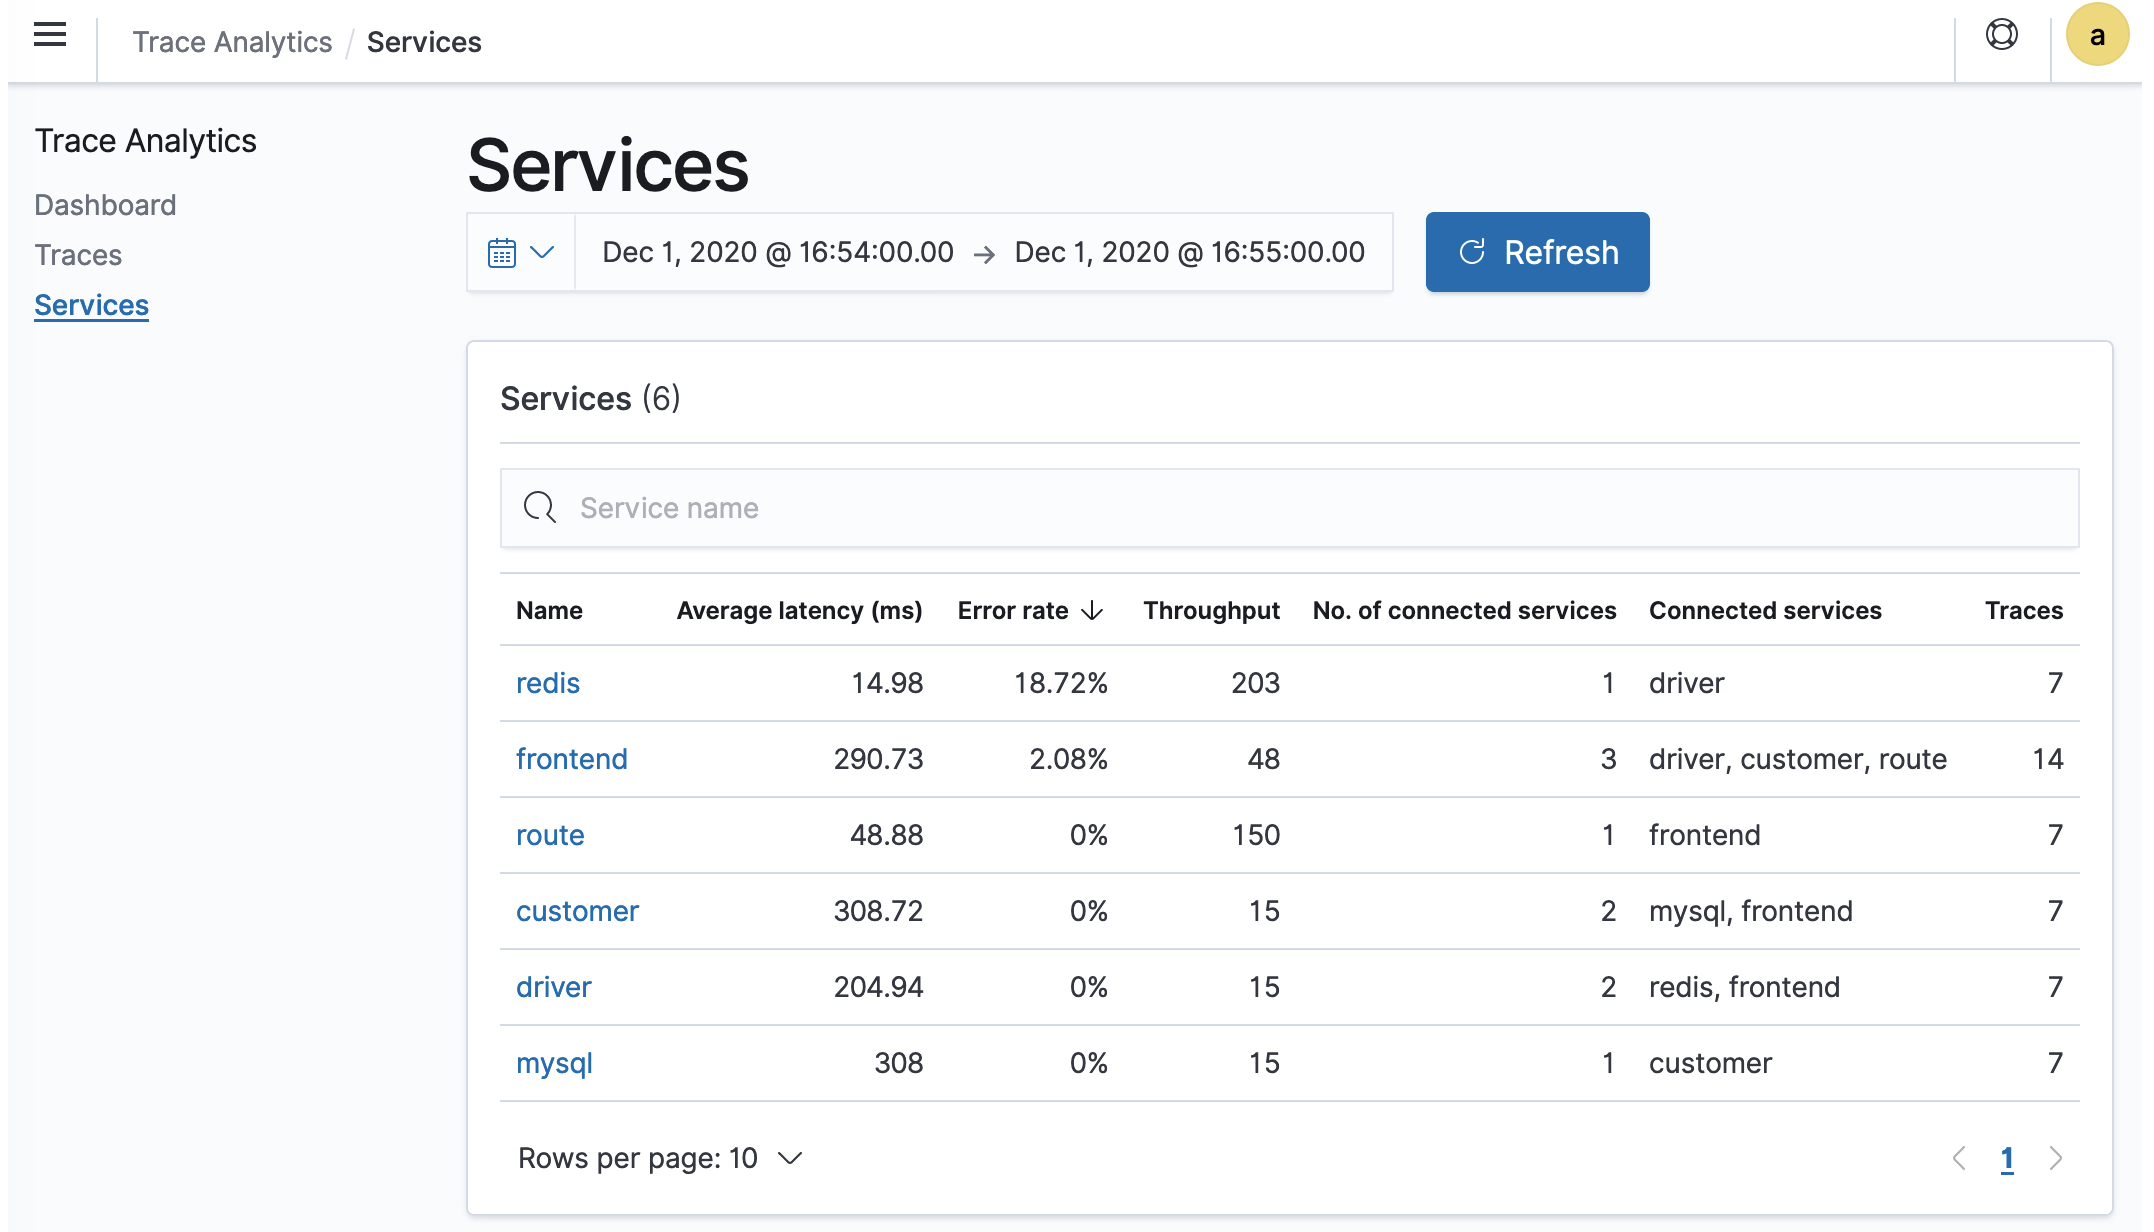
Services (服務) 檢視會列出應用程式中的所有服務,以及顯示各種服務如何彼此互連的互動式地圖。與儀表板 (可協助依操作發現問題) 相反,服務地圖可協助您透過服務發現問題。嘗試依錯誤率或延遲排序,以了解應用程式的潛在問題區域。