Viewing DB cluster metrics in the CloudWatch console and AWS CLI
Following, you can find details about how to view metrics for your DB instance using CloudWatch. For information on monitoring metrics for your DB instance's operating system in real time using CloudWatch Logs, see Monitoring OS metrics with Enhanced Monitoring.
When you use Amazon Aurora resources, Amazon Aurora sends metrics and dimensions to Amazon CloudWatch every minute.
You can now export Performance Insights metrics dashboards from Amazon RDS to Amazon CloudWatch and view these metrics in the CloudWatch console. For more information on how to export the Performance Insights metrics dashboards to CloudWatch, see Exporting Performance Insights metrics to CloudWatch.
Use the following procedures to view the metrics for Amazon Aurora in the CloudWatch console and CLI.
To view metrics using the Amazon CloudWatch console
Metrics are grouped first by the service namespace, and then by the various dimension combinations within each namespace.
-
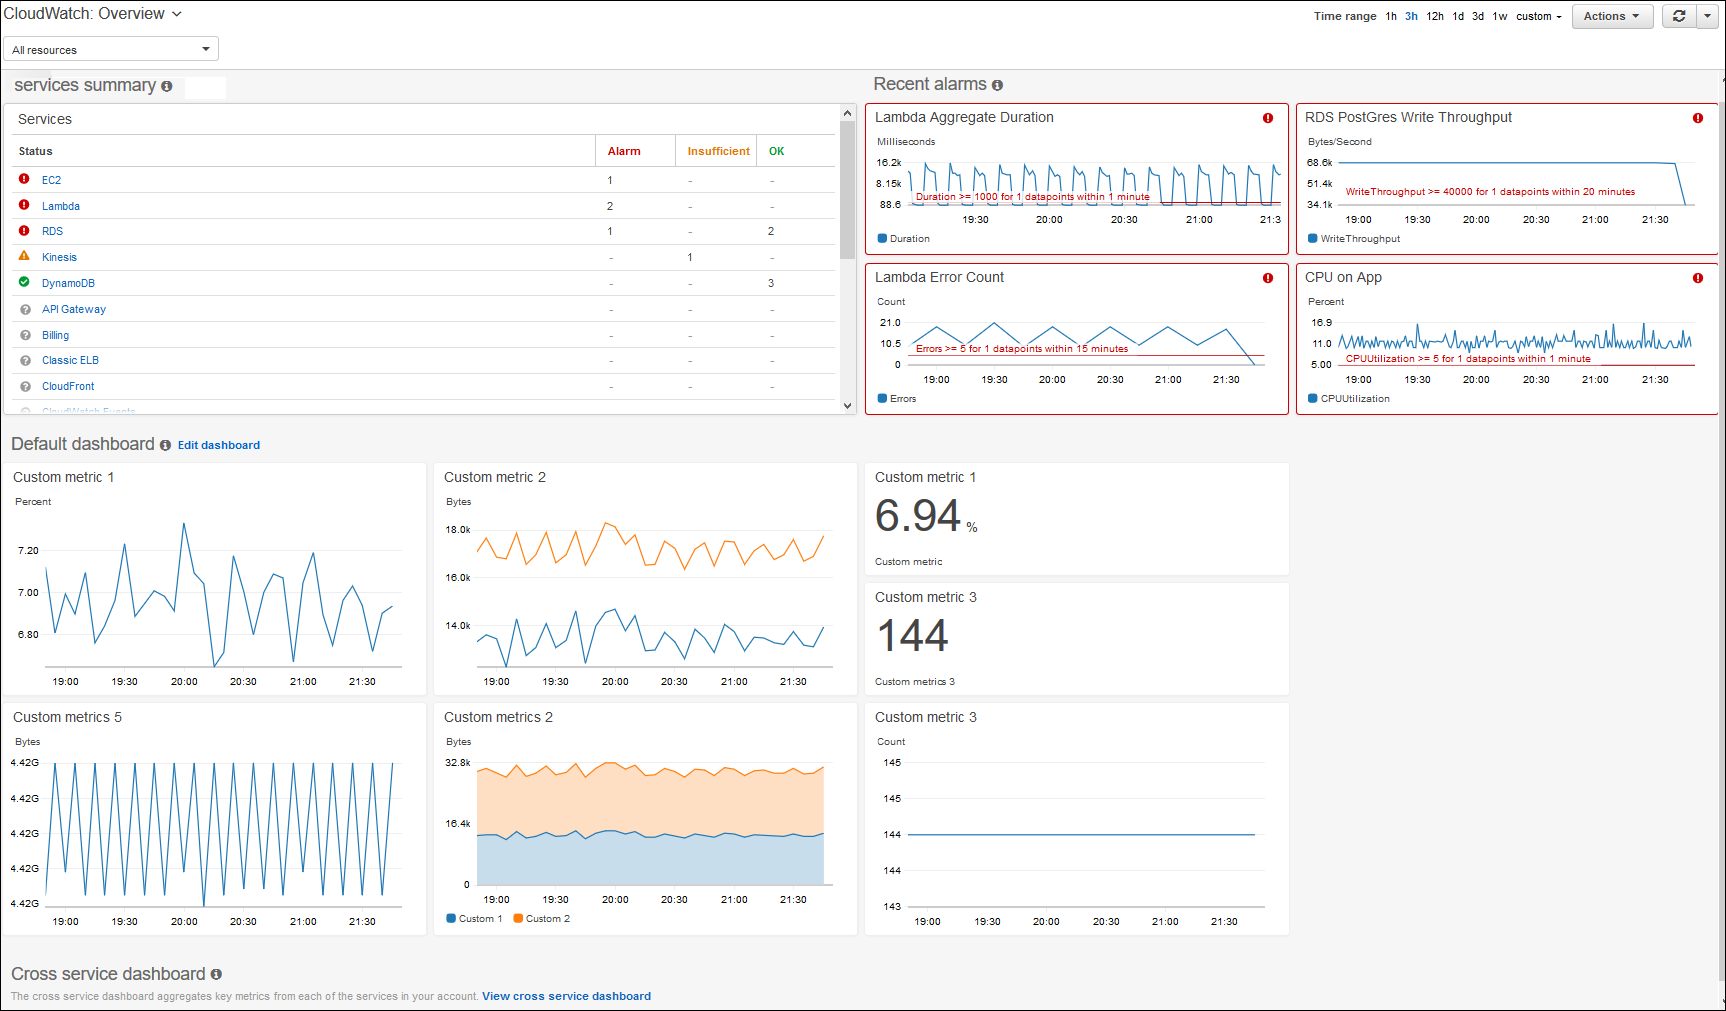
Open the CloudWatch console at https://console.aws.amazon.com/cloudwatch/
. The CloudWatch overview home page appears.
-
If necessary, change the AWS Region. From the navigation bar, choose the AWS Region where your AWS resources are. For more information, see Regions and endpoints.
-
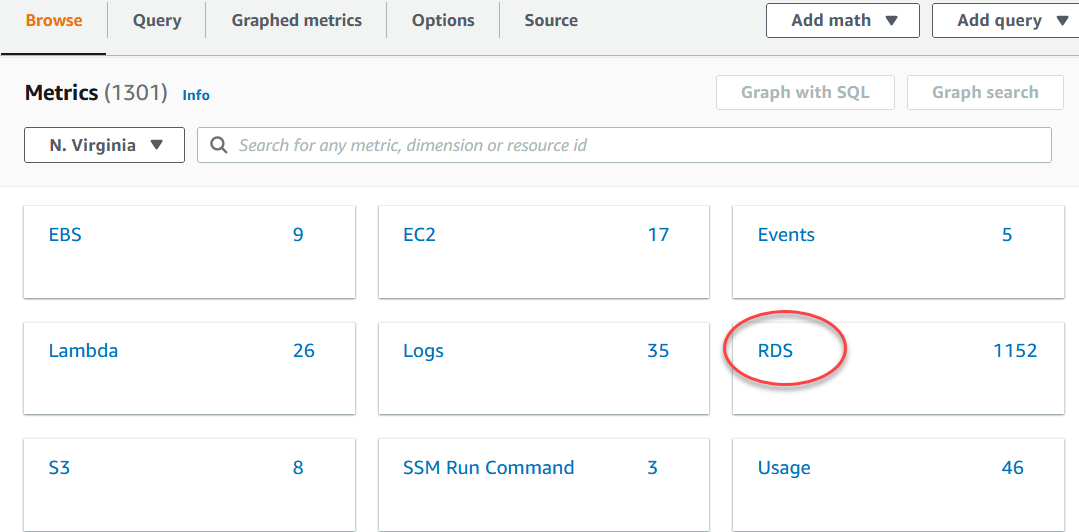
In the navigation pane, choose Metrics and then All metrics.
-
Scroll down and choose the RDS metric namespace.
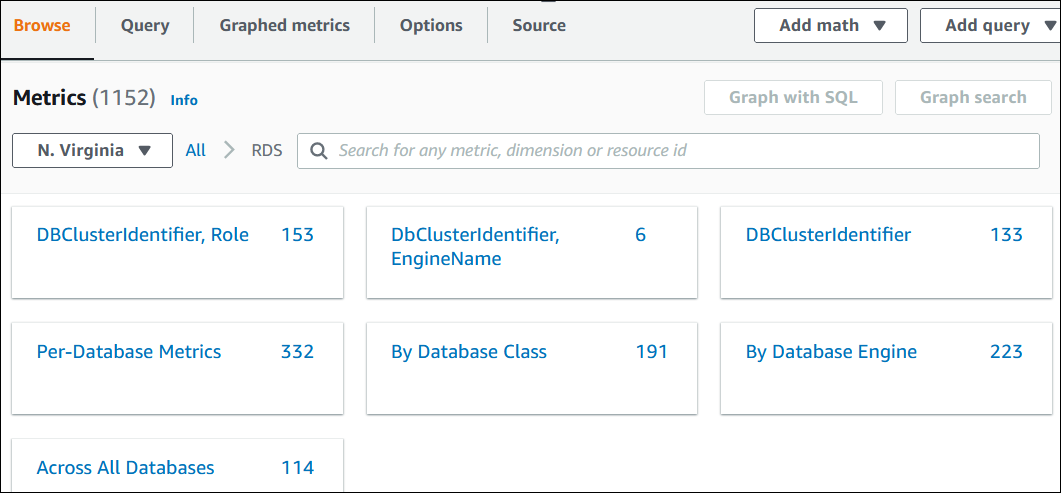
The page displays the Amazon Aurora dimensions. For descriptions of these dimensions, see Amazon CloudWatch dimensions for Aurora.
-
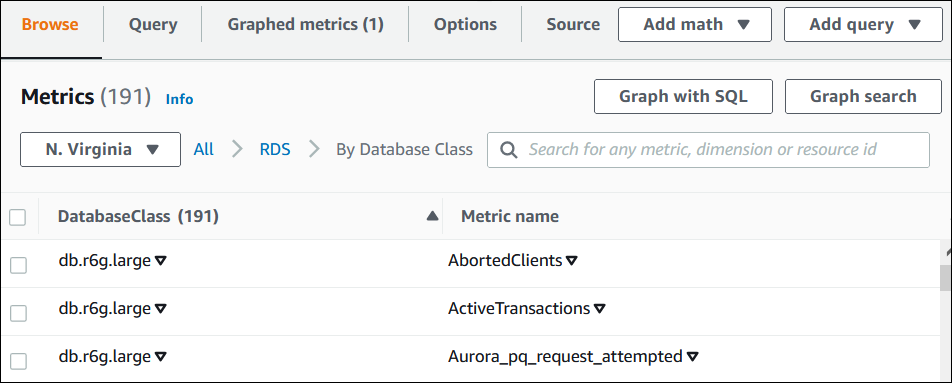
Choose a metric dimension, for example By Database Class.
-
Do any of the following actions:
-
To sort the metrics, use the column heading.
-
To graph a metric, select the check box next to the metric.
-
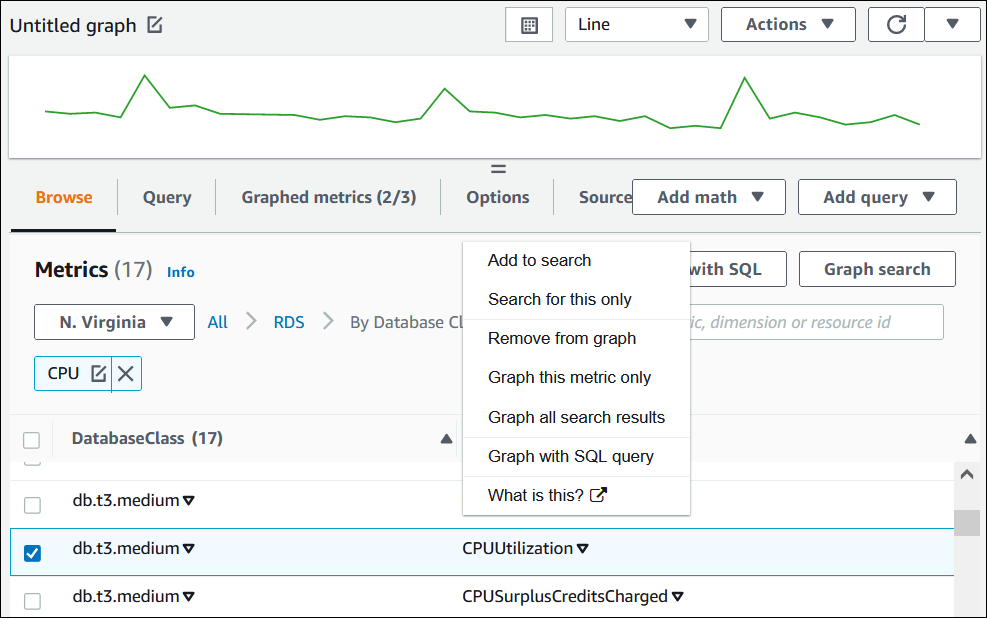
To filter by resource, choose the resource ID, and then choose Add to search.
-
To filter by metric, choose the metric name, and then choose Add to search.
The following example filters on the db.t3.medium class and graphs the CPUUtilization metric.
-
You can find details about how to analyze resource usage for Aurora PostgreSQL using CloudWatch metrics. For more information, see Using Amazon CloudWatch metrics to analyze resource usage for Aurora PostgreSQL
To obtain metric information by using the AWS CLI, use the CloudWatch command list-metrics. In the following
example, you list all metrics in the AWS/RDS namespace.
aws cloudwatch list-metrics --namespace AWS/RDS
To obtain metric data, use the command get-metric-data.
The following example gets CPUUtilization statistics for instance my-instance
over the specific 24-hour period, with a 5-minute granularity.
Create a JSON file CPU_metric.json with the following contents.
{ "StartTime" :"2023-12-25T00:00:00Z", "EndTime" :"2023-12-26T00:00:00Z", "MetricDataQueries" : [{ "Id" : "cpu", "MetricStat" : { "Metric" : { "Namespace" : "AWS/RDS", "MetricName" : "CPUUtilization", "Dimensions" : [{ "Name" : "DBInstanceIdentifier" , "Value" :my-instance}] }, "Period" : 360, "Stat" : "Minimum" } }] }
For Linux, macOS, or Unix:
aws cloudwatch get-metric-data \
    --cli-input-json file://CPU_metric.json
For Windows:
aws cloudwatch get-metric-data ^
     --cli-input-json file://CPU_metric.json
Sample output appears as follows:
{
    "MetricDataResults": [
        {
            "Id": "cpu",
            "Label": "CPUUtilization",
            "Timestamps": [
                "2023-12-15T23:48:00+00:00",
                "2023-12-15T23:42:00+00:00",
                "2023-12-15T23:30:00+00:00",
                "2023-12-15T23:24:00+00:00",
                ...
            ],
            "Values": [
                13.299778337027714,
                13.677507543049558,
                14.24976250395827,
                13.02521708695145,
                ...
            ],
            "StatusCode": "Complete"
        }
    ],
    "Messages": []
}
For more information, see Getting statistics for a metric in the Amazon CloudWatch User Guide.
