Monitoring Amazon RDS metrics with Amazon CloudWatch
Amazon CloudWatch is a metrics repository. The repository collects and processes raw data from Amazon RDS into readable, near real-time metrics. For a complete list of Amazon RDS metrics sent to CloudWatch, see Metrics reference for Amazon RDS.
To analyze and troubleshoot the performance of your databases at scale, use CloudWatch Database Insights.
Topics
Overview of Amazon RDS and Amazon CloudWatch
By default, Amazon RDS automatically sends metric data to
CloudWatch in 1-minute periods. For example, the CPUUtilization metric records the percentage of CPU utilization for a DB instance over
time. Data points with a period of 60 seconds (1 minute) are available for 15 days. This means that you can access historical information and
see how your web application or service is performing.
You can now export Performance Insights metrics dashboards from Amazon RDS to Amazon CloudWatch. You can export either the preconfigured or customized metrics dashboards as a new dashboard or add them to an existing CloudWatch dashboard. The exported dashboard is available to view in the CloudWatch console. For more information on how to export the Performance Insights metrics dashboards to CloudWatch, see Exporting Performance Insights metrics to CloudWatch.
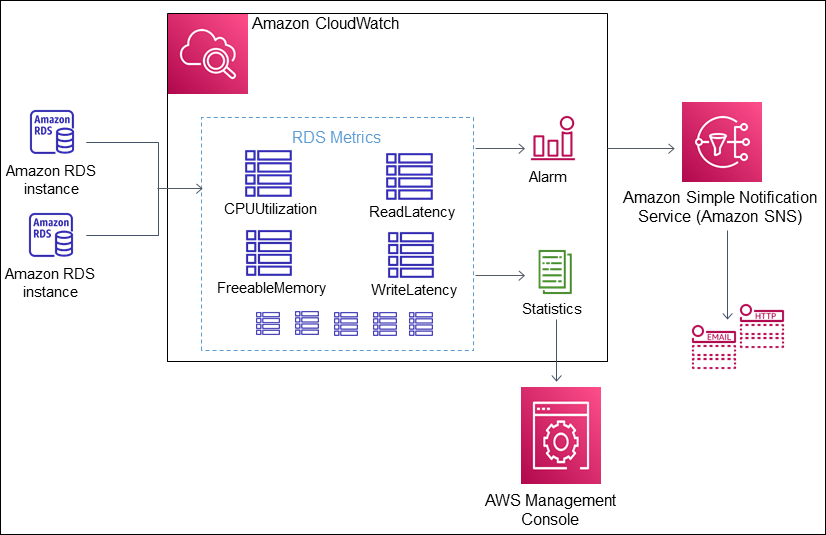
As shown in the following diagram, you can set up alarms for your CloudWatch metrics. For example, you might create an alarm that signals when the CPU utilization for an instance is over 70%. You can configure Amazon Simple Notification Service to email you when the threshold is passed.
Amazon RDS publishes the following types of metrics to Amazon CloudWatch:
-
Metrics for your RDS DB instances
For a table of these metrics, see Amazon CloudWatch metrics for Amazon RDS.
-
Performance Insights metrics
For a table of these metrics, see Amazon CloudWatch metrics for Amazon RDS Performance Insights and Performance Insights counter metrics.
-
Enhanced Monitoring metrics (published to Amazon CloudWatch Logs)
For a table of these metrics, see OS metrics in Enhanced Monitoring.
-
Usage metrics for the Amazon RDS service quotas in your AWS account
For a table of these metrics, see Amazon CloudWatch usage metrics for Amazon RDS. For more information about Amazon RDS quotas, see Quotas and constraints for Amazon RDS.
For more information about CloudWatch, see What is Amazon CloudWatch? in the Amazon CloudWatch User Guide. For more information about CloudWatch metrics retention, see Metrics retention.
