Use AWS X-Ray service maps and trace views with API Gateway
In this section you can find detailed information on how to use AWS X-Ray service maps and trace views with API Gateway.
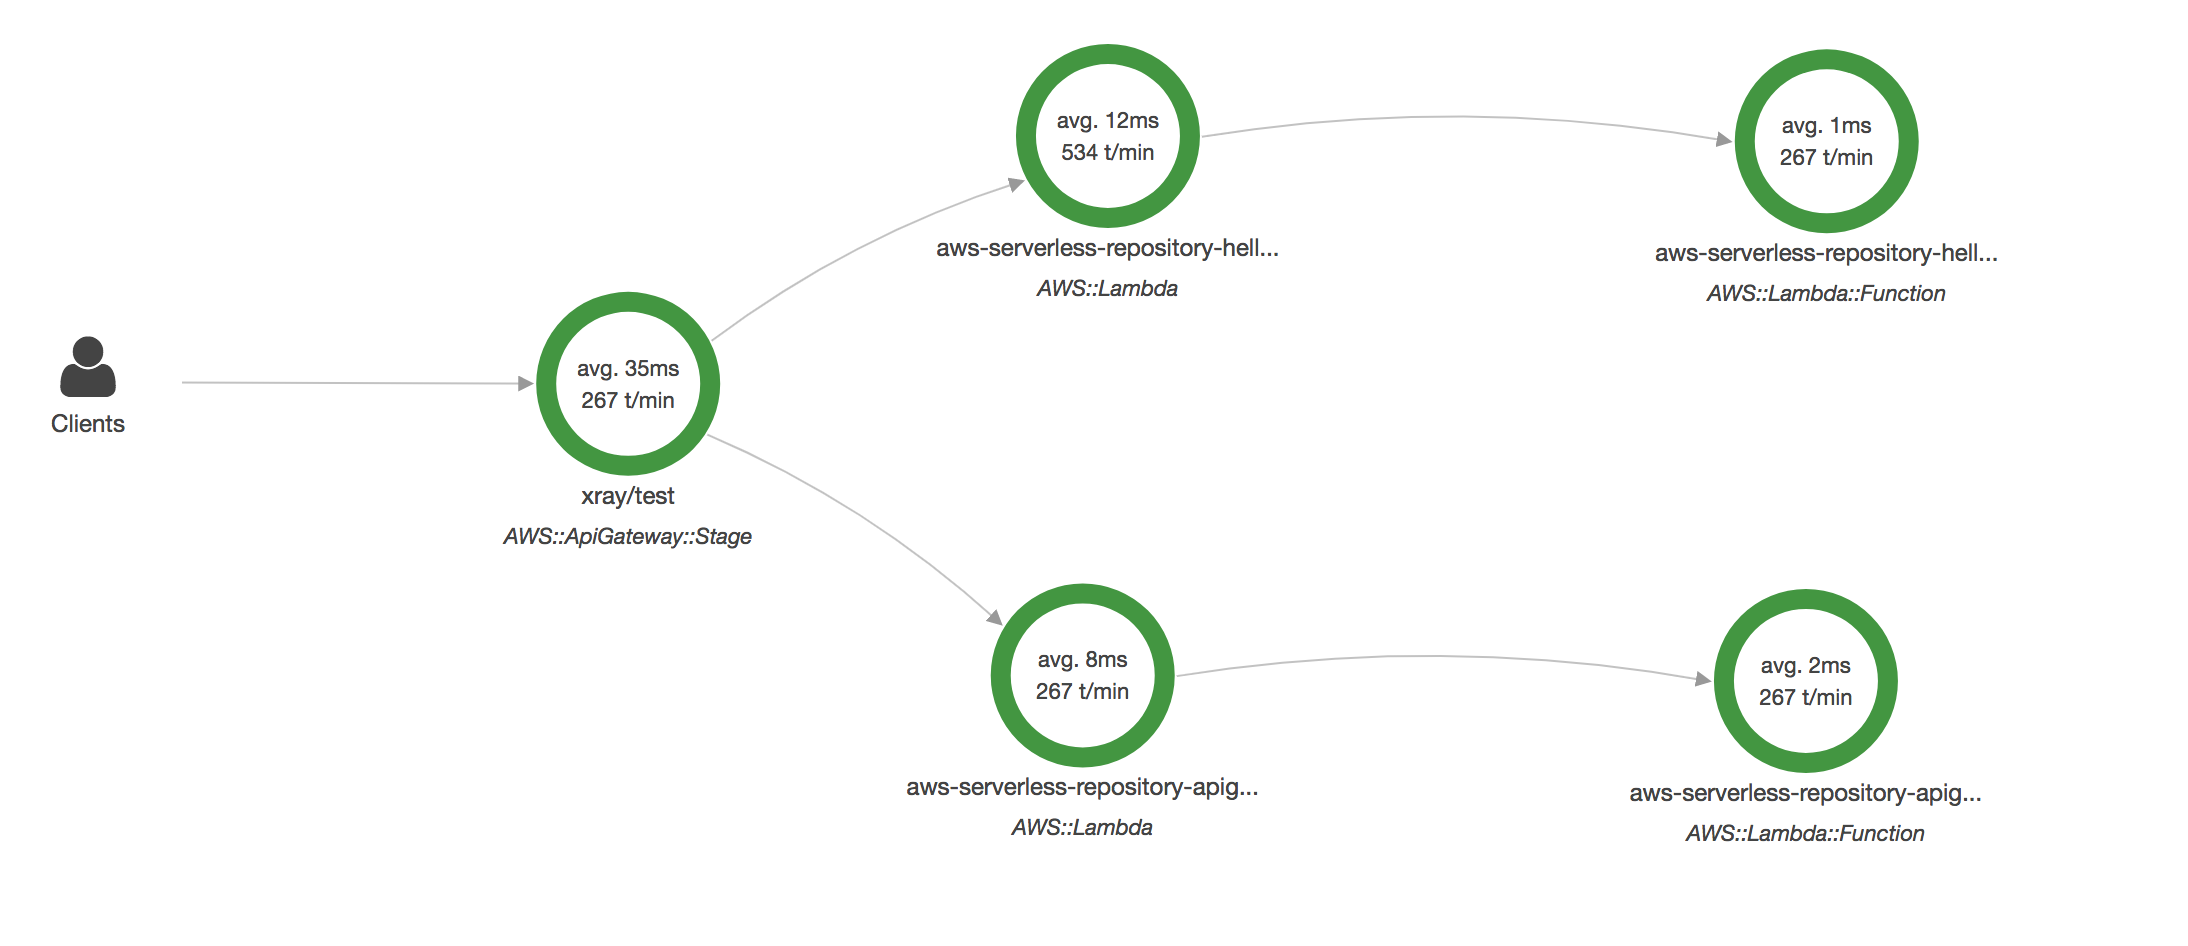
Example X-Ray service map
AWS X-Ray service maps show information about your API and all of its downstream services. When X-Ray is enabled for an API stage in API Gateway, you'll see a node in the service map containing information about the overall time spent in the API Gateway service. You can get detailed information about the response status and a histogram of the API response time for the selected timeframe. For APIs integrating with AWS services such as AWS Lambda and Amazon DynamoDB, you will see more nodes providing performance metrics related to those services. There will be a service map for each API stage.
The following example shows a service map for the test stage of an API called xray.
This API has two Lambda integrations. The nodes represent the API Gateway service and the two Lambda functions.
For a detailed explanation of service map structure, see Use the X-Ray trace map.
From the service map, you can zoom in to see a trace view of your API stage. The trace will display in-depth information regarding your API, represented as segments and subsegments. For example, the trace for the service map shown above would include segments for the Lambda service and Lambda function. For more information, see AWS Lambda and AWS X-Ray.
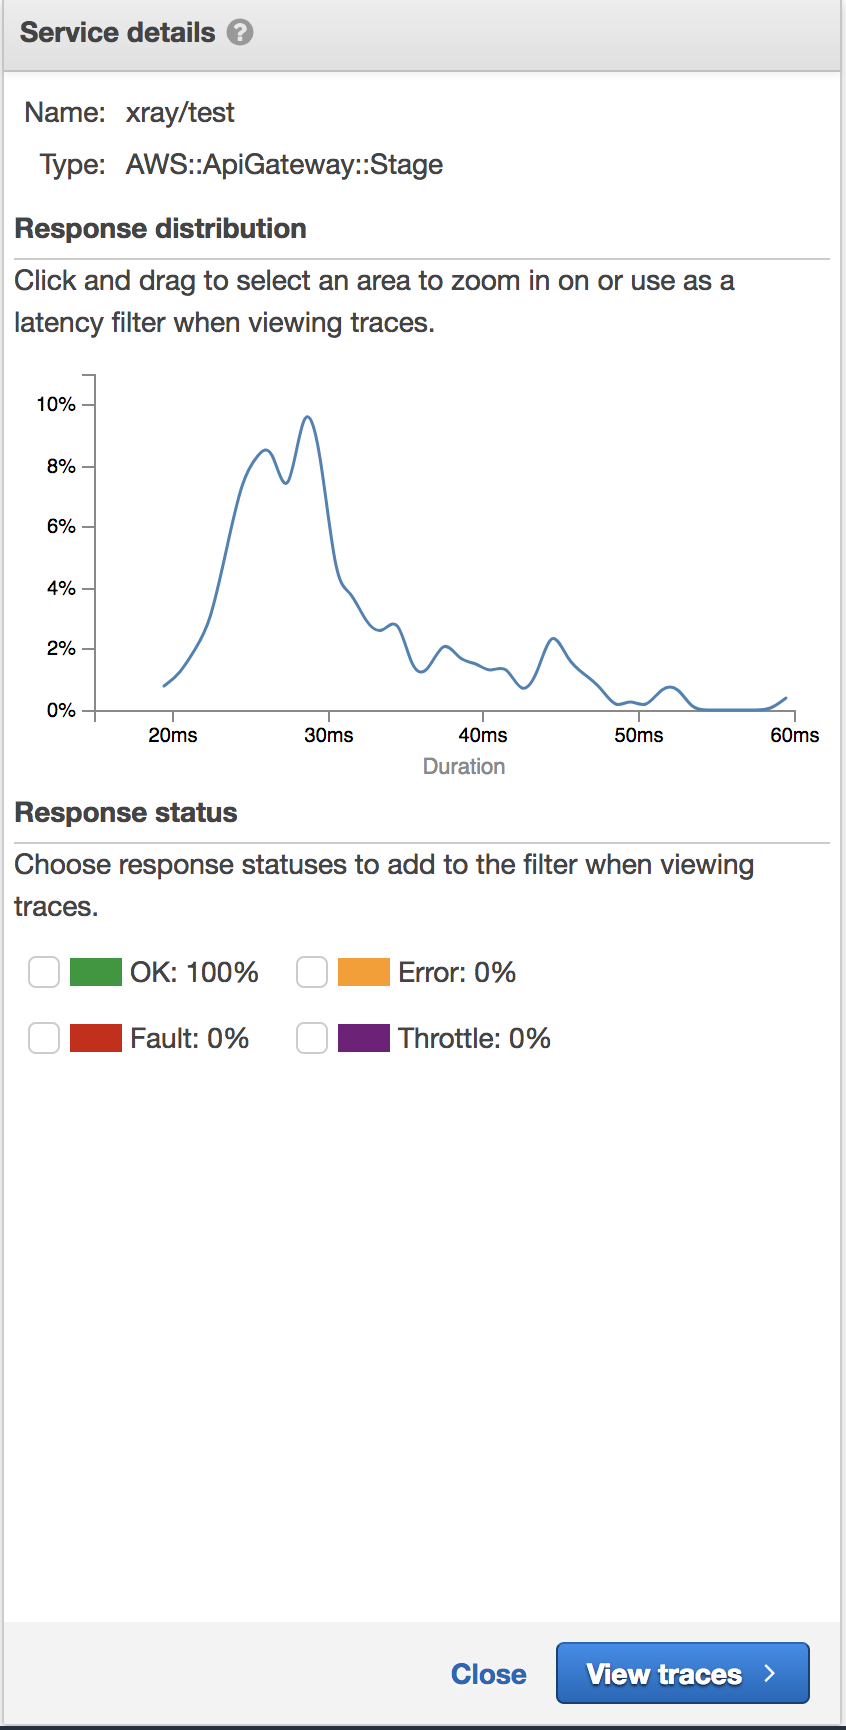
If you choose a node or edge on an X-Ray service map, the X-Ray console shows a
latency distribution histogram. You can use a latency histogram to see how long it takes
for a service to complete its requests. Following is a histogram of the API Gateway stage
named xray/test in the previous service map. For a detailed explanation of
latency distribution histograms, see
Use
Latency Histograms.
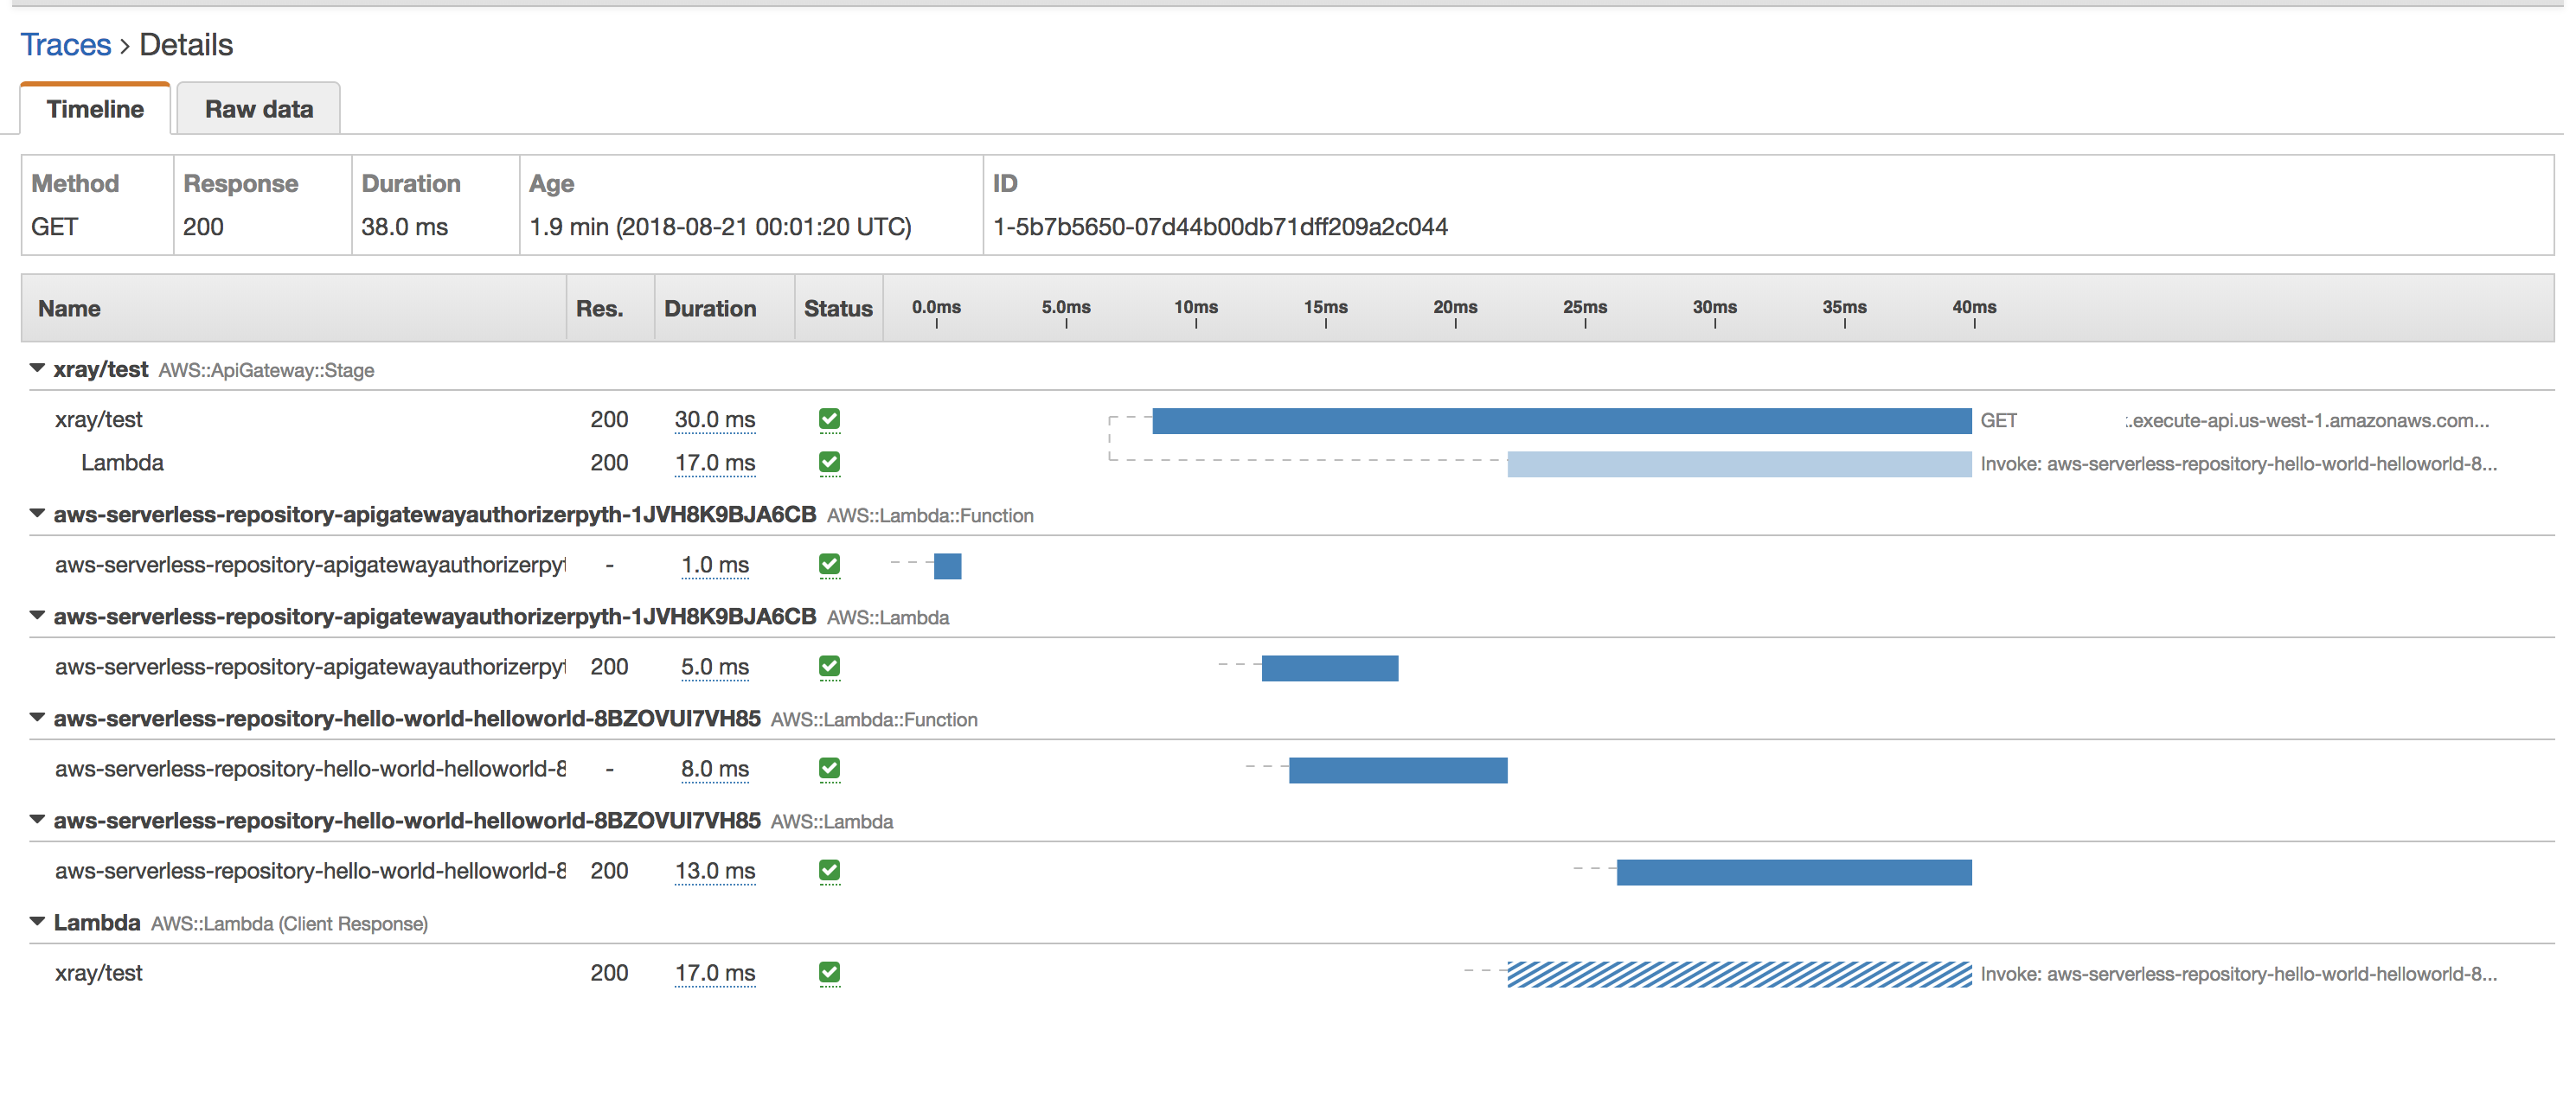
Example X-Ray trace view
The following diagram shows a trace view generated for the example API described above, with a Lambda backend function. A successful API method request is shown with a response code of 200.
For a detailed explanation of trace views, see View traces and trace details.