Java sample application
This tutorial walks through the complete setup necessary to run Amazon CodeGuru Profiler within two sample applications: one that features issues to generate CodeGuru Profiler recommendations and one that does not. You can then view the resulting CodeGuru Profiler runtime data and recommendations.
To view the sample application, navigate to the CodeGuru Profiler demo
application
This tutorial’s sample application does some basic image processing, with some CPU-heavy operations alongside some IO-heavy operations. It uses an Amazon Simple Storage Service bucket for cloud storage of images and an Amazon Simple Queue Service queue to order the names of images to be processed. It consists chiefly of two components which run in parallel, the task publisher and the image processor:
TaskPublisher checks the S3 bucket for available images, and submits the name
of some of these images to the SQS queue.
ImageProcessor polls SQS for names of images to process. Processing an image
involves downloading it from S3, applying some image transforms (e.g. converting to
monochrome), and uploading the result back to S3.
When running DemoApplication-WithIssues, you see messages such as
Expensive exception and Pointless work being logged. This is
expected, and you can see how these issues appear on the CodeGuru Profiler console.
Option 1: Quick demo
The results of this application are available to review within the CodeGuru console. There is no need to run the code if you just want to see the CodeGuru Profiler output.
-
Sign in to the AWS Management Console, and then open the CodeGuru Profiler console at https://console.aws.amazon.com/codeguru/profiler
. -
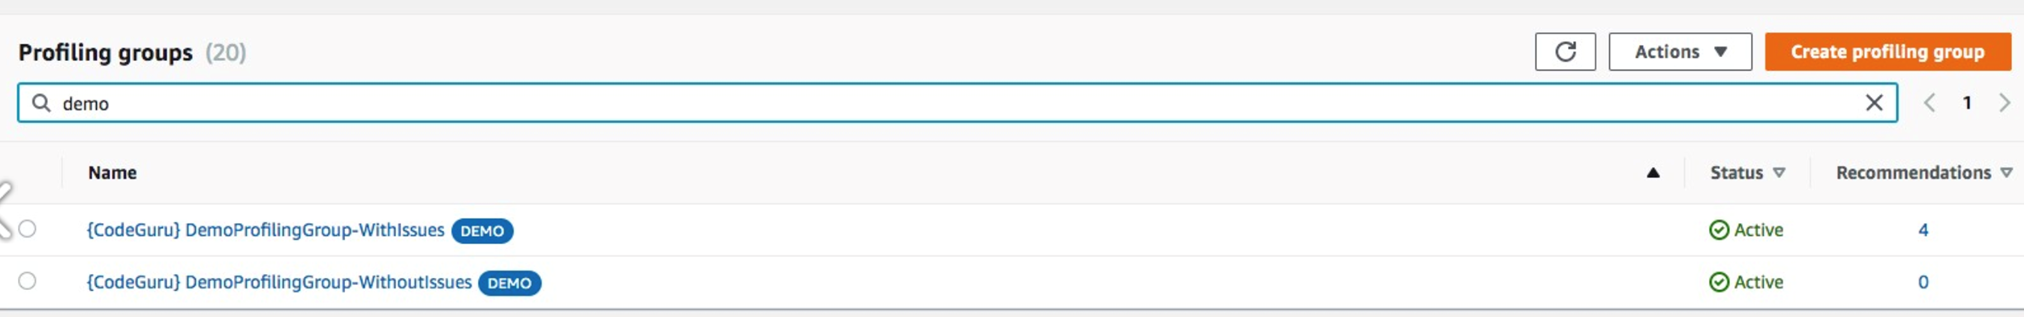
In the navigation pane on the left, choose Profiler, and then choose Profiling groups.
-
On the Profiling groups page, choose
{CodeGuru} DemoProfilingGroup-WithIssuesand{CodeGuru} DemoProfilingGroup-WithoutIssuesto view runtime performance data and recommendations. To better understand the console, see step 4.
Option 2: Complete demo
Prerequisites
For this tutorial, you will need:
-
The latest version of the AWS Command Line Interface. For more information, see Installing, updating, and uninstalling the AWS Command Line Interface.
-
Maven to build and run the code. For information on installing Maven, see Welcome to Apache Maven
. -
The sample application
cloned to your desired directory.
Step 1: Create AWS resources
Set up the required components by running the following AWS commands in your terminal.
-
Configure the AWS CLI.
When prompted, specify the AWS access key and AWS secret access key of the IAM user that you will use with CodeGuru Profiler.
When prompted for the default Region name, specify the Region where you will create the pipeline, such as
us-west-2.When prompted for the default output format, specify the .json.
aws configure -
Create two profiling groups in CodeGuru Profiler, named
DemoApplication-WithIssuesandDemoApplication-WithoutIssues.aws codeguruprofiler create-profiling-group --profiling-group-name DemoApplication-WithIssues aws codeguruprofiler create-profiling-group --profiling-group-name DemoApplication-WithoutIssues -
Create an Amazon SQS queue.
aws sqs create-queue --queue-name DemoApplicationQueue -
Create an Amazon S3 bucket. Replace the YOUR-BUCKET with your desired bucket name.
aws s3 mb s3://demo-application-test-bucket-YOUR-BUCKET -
Provision an IAM role. For information, see Creating IAM roles or use one that is associated with your AWS account.
Attach the
AmazonSQSFullAccess, AmazonS3FullAccess,andAmazonCodeGuruProfilerFullAccessAWS managed policies to the IAM role.
Step 2: Run a sample application
Follow these steps to run one of the sample applications. You select which sample application to run in step 2. To run the other sample application, repeat the following steps, selecting the other sample application in step 2.
-
Export the Amazon SQS URL, the S3; bucket name, and the target Region.
Remember to replace
YOUR-AWS-REGION,YOUR-ACCOUNT-ID, andYOUR-BUCKET.YOUR-AWS-REGIONshould be the Region you specified in the AWS CLI configuration.YOUR-ACCOUNT-IDshould be your AWS account ID.YOUR-BUCKETshould be the bucket name you specified during Amazon S3 bucket creation.export DEMO_APP_SQS_URL=https://sqs.YOUR-AWS-REGION.amazonaws.com/YOUR-ACCOUNT-ID/DemoApplicationQueue export DEMO_APP_BUCKET_NAME=demo-application-test-bucket-1092734-YOUR-BUCKET export AWS_CODEGURU_TARGET_REGION=YOUR-AWS-REGION -
Export the CodeGuru Profiler profiling group
To run the sample application with issues, run the following command.
export AWS_CODEGURU_PROFILER_GROUP_NAME=DemoApplication-WithIssuesTo run the sample application without issues, run the following command.
export AWS_CODEGURU_PROFILER_GROUP_NAME=DemoApplication-WithoutIssues -
Generate the sample application .jar file.
1. mvn clean install -
Run the demo.
java -javaagent:codeguru-profiler-java-agent-standalone-1.2.6.jar \ -jar target/DemoApplication-1.0-jar-with-dependencies.jar with-issues -
Verify that your profiling group is running.
Navigate to the CodeGuru Profiler console
. Choose Profiling groups.
The
DemoApplication-WithIssuesprofiling group should have the status Pending. You may need to wait a few minutes for this to update. After running the demo for around 15 minutes, the group should have the status Profiling.Run the demo for a few hours to generate ample data for recommendations.
Step 3: Understanding the console
The CodeGuru Profiler console is where you can view the data that Profiler has gathered from running the application.
-
Navigate to the CodeGuru Profiler console
. -
Choose Profiling groups.
-
Choose the
DemoApplication-WithIssuesor theDemoApplication-WithoutIssuesprofiling group
The following sections are displayed, along with options for other visualizations or a full recommendations report.
-
Profiling group status displays the status of the profiling group and metrics from data collected in the past 12 hours.
-
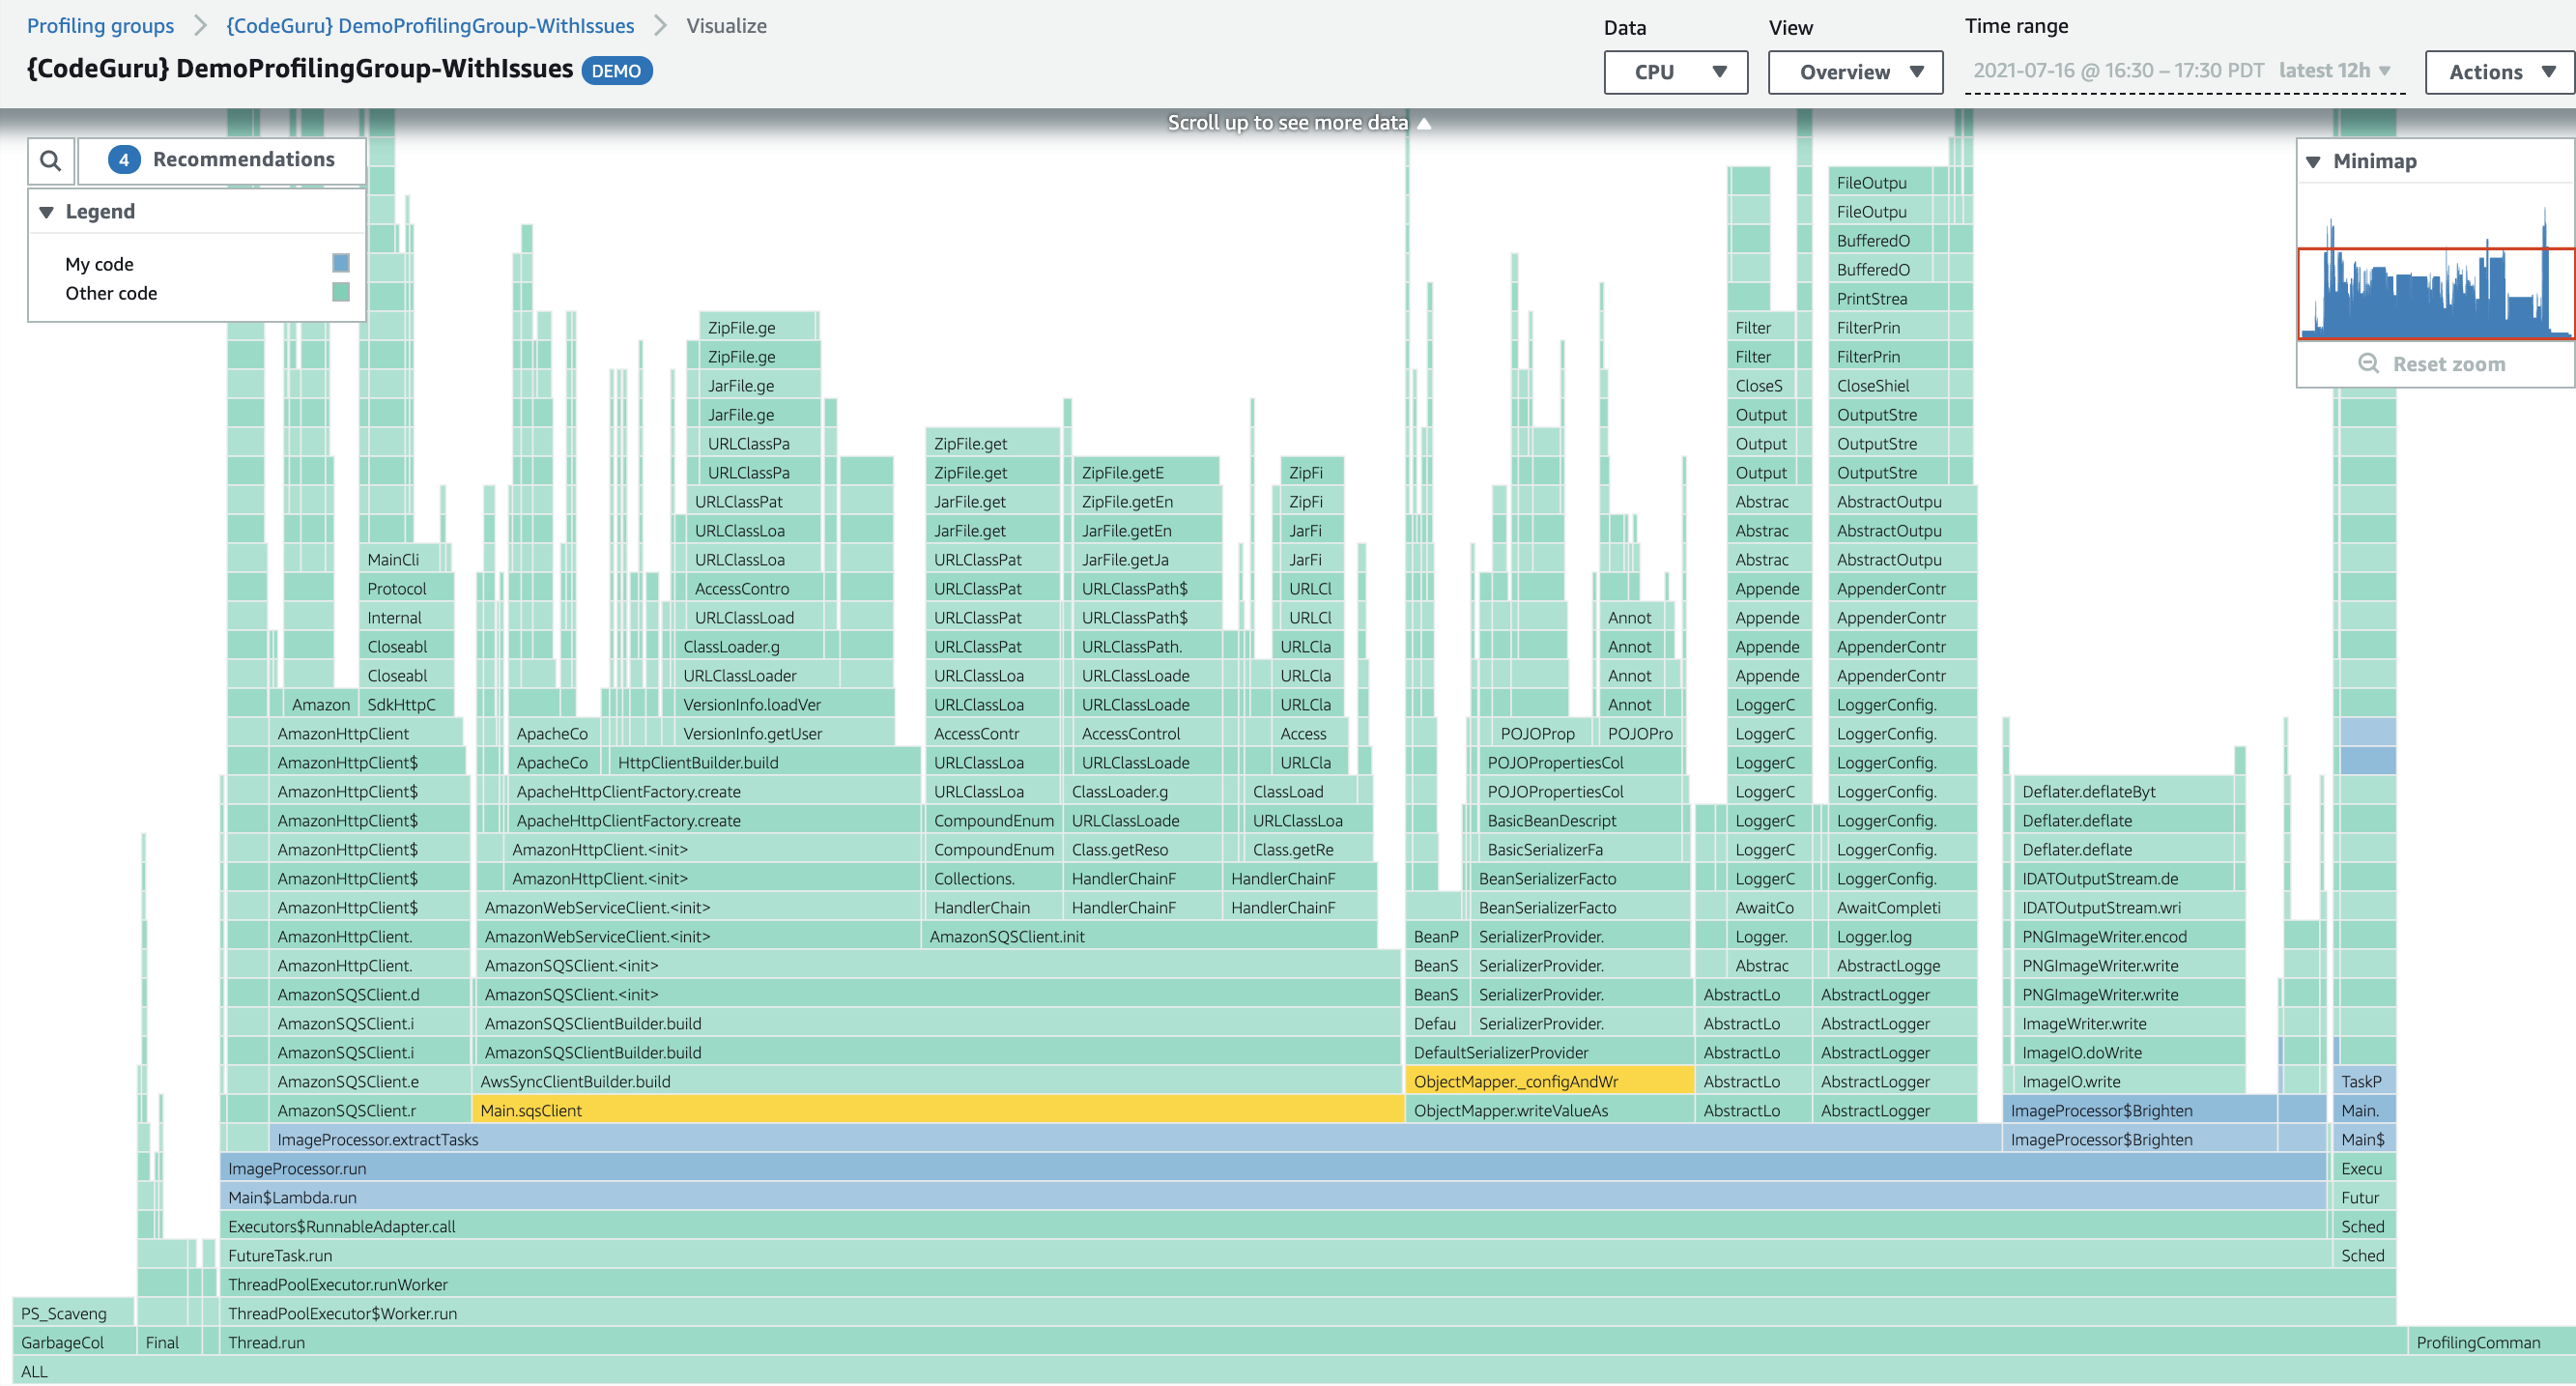
CPU summary displays the amount of system CPU capacity that the application consumes. You can choose Visualize CPU to view the flame graph.
-
Latency summary displays the amount of time the application’s threads spend in the Blocked, Waiting, and Timed Waiting thread states.
-
Heap usage displays how much of your application's maximum heap capacity is consumed by the application.
-
Anomalies display any deviations from trends that CodeGuru Profiler detects.
-
Recommendations display suggestions to optimize the application.
The DemoApplication-WithIssues generates recommendations, while the
DemoApplication-WithoutIssues does not. These recommendations have to do
with the purposefully inefficient lines of code that unnecessarily recreate loggers, SDK
service clients, and Jackson Object Mappers. You can choose View
report next to the Recommendations section for more
details on these inefficiencies, including their location, estimated costs, and suggested
resolution steps.
The average heap usage in the DemoApplication-WithIssues is significantly
higher, indicating that the application requires significantly more memory.
Cleanup
Upon completion of this tutorial, clean up the resources created.
Delete the profiling groups by following the procedure in Deleting a profiling group.
Delete the Amazon S3 bucket, replacing YOUR-BUCKET with your specified bucket
name. Note that all objects stored in the bucket will be deleted as well.
aws s3 rb s3://demo-application-test-bucket-1092734-YOUR-BUCKET --force
Delete the Amazon SQS queue. Note that this will delete the queue itself, not just the messages in the queue.
aws sqs delete-queue
