Amazon Forecast is no longer available to new customers. Existing customers of
Amazon Forecast can continue to use the service as normal.
Learn more"
Getting Started (Console)
In this exercise, you use the Amazon Forecast console to import time-series data of electricity usage, create an predictor based on the input dataset, and make predictions of future electricity usage based on the forecast horizon.
For this exercise, you use a modified version the individual household electric power
consumption dataset. (Dua, D. and Karra Taniskidou, E. (2017). UCI Machine Learning Repository
[http://archive.ics.uci.edu/ml
Prerequisites
-
An AWS account. If you don't already have an AWS account, create one as described in Sign Up for AWS.
-
Training data in your Amazon Simple Storage Service (Amazon S3) bucket. For more information, see Prepare Input Data.
-
An AWS Identity and Access Management (IAM) role that allows Amazon Forecast to read and write to your S3 buckets. For more information, see Create an IAM Role for Amazon Forecast (IAM Console).
Be aware that there are several steps in this exercise that require several minutes to a few hours to complete.
To import time-series data into Amazon Forecast, create a dataset group, choose a domain for your dataset group, specify the details of your data, and point Amazon Forecast to the S3 location of your data. The target time series used in this example is historical electricity usage data.
Note
This exercise assumes that you have not created any dataset groups. If you previously created a dataset group, what you see will vary slightly from the following screenshots and instructions.
To import time-series data for forecasting
-
Open the Amazon Forecast console at https://console.aws.amazon.com/forecast/
. -
On the Amazon Forecast home page, choose Create dataset group.
-
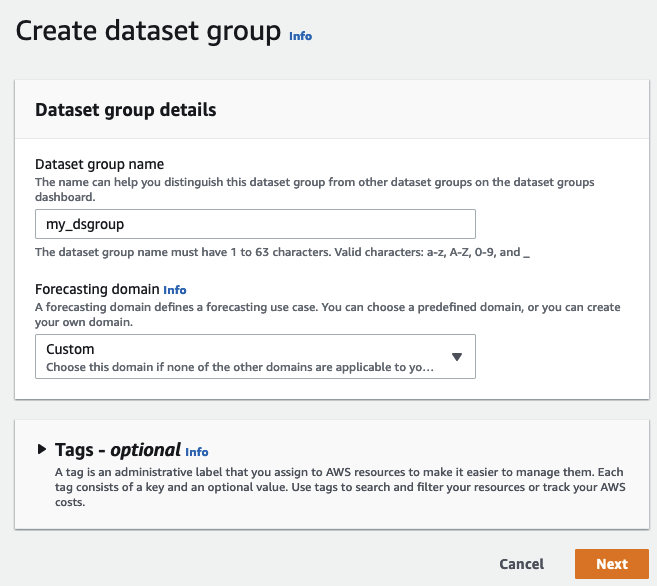
On the Create dataset group page, for Dataset group details, provide the following information:
-
Dataset group name – Enter a name for your dataset group.
-
Forecasting domain – From the drop-down menu, choose Custom. For more information about how to choose a forecasting domain, see dataset domains and types.
Leave the Tags section unchanged. Your screen should look similar to the following:
-
-
Choose Next.
-
On the Create target time series dataset page, for Dataset details, provide the following information:
-
Dataset name – Enter a name for your dataset.
-
Frequency of your data – Keep the default value of
1, and choose hour from the drop-down menu. This setting must be consistent with the input time series data. The time interval in the sample electricity-usage data is an hour. Data schema – Choose Schema builder and drag the column components to match the time-series data order from top to bottom.
-
timestamp - Use the default Timestamp Format of
yyyy-MM-dd HH:mm:ss. -
target_value
-
item_id
For the electricity usage input data, the columns correspond to: a timestamp, the electricity usage at the specified time (target_value), and the ID of the customer charged for the electricity usage (string). The order of the columns and the timestamp format specified here must be consistent with the input time series data.
-
The Dataset details panel should look similar to the following:

-
-
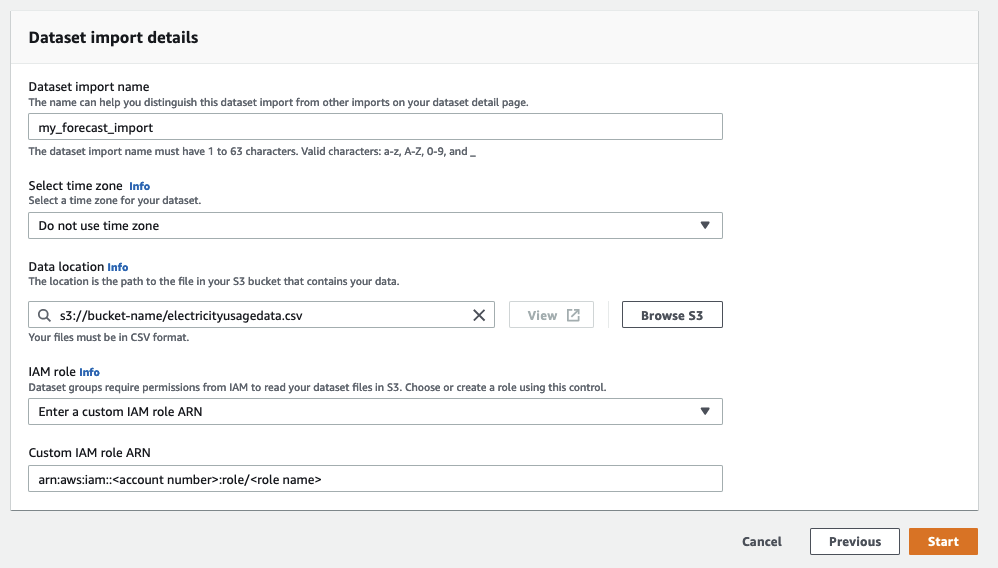
For Dataset import details, provide the following information:
-
Dataset import name – Enter a name for your dataset.
-
Select time zone – Leave the default selected (Do not use time zone).
-
Data location – Use the following format to enter the location of your .csv file on Amazon S3:
s3://<name of your S3 bucket>/<folder path>/<filename.csv> -
IAM role – Keep the default Enter a custom IAM role ARN.
Alternatively, you can have Amazon Forecast create the required IAM role for you by choosing Create a new role from the drop-down menu and following the on-screen instructions.
-
Custom IAM role ARN – Enter the Amazon Resource Name (ARN) of the IAM role that you created in Create an IAM Role for Amazon Forecast (IAM Console).
The Dataset import details panel should look similar to the following:
-
-
Choose Start. If you are returned to the Amazon Forecast home page, choose View dataset group.
-
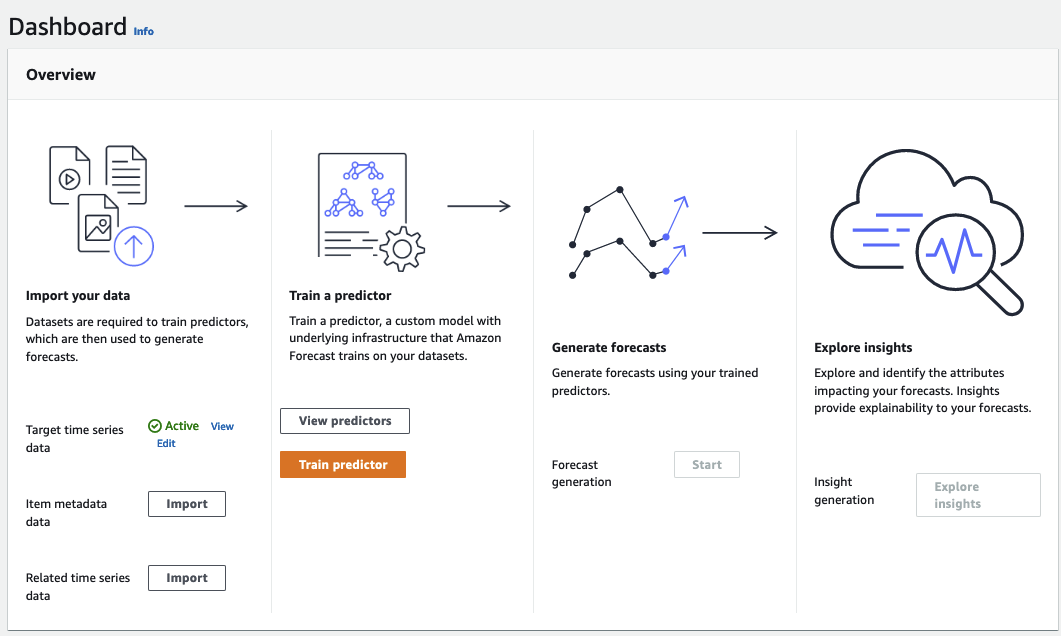
Click the name of the dataset group that you just created. The dataset group's Dashboard page is displayed. Your screen should look similar to the following:

Next to Target time series data, you will see the status of the import job. Wait for Amazon Forecast to finish importing your time series data. The process can take several minutes or longer. When your dataset has been imported, the status transitions to Active and the banner at the top of the dashboard notifies you that you have successfully imported your data.
Now that your target time series dataset has been imported, you can create a predictor.
Next you create a predictor, which you use to generate forecasts based on your time series data. Forecast applies the optimal combination of algorithms to each time series in your datasets
To create a predictor with the Forecast console, you specify a predictor name, a forecast frequency, and define a forecast horizon. For more information about the additional fields you can configure, see Training Predictors.
To create a predictor
-
After your target time series dataset has finished importing, your dataset group's Dashboard should look similar to the following:

Under Train a predictor, choose Start. The Train predictor page is displayed.
Note
The
Statusof the Target time series data must beActive, which signifies that the import successfully finished, before you can train the predictor. -
On the Train predictor page, for Predictor settings, provide the following information:
-
Predictor name – Enter a name for your predictor.
-
Forecast frequency – Keep the default value of
1. From the drop-down menu, choose hour. This setting must be consistent with the input time series data. The time interval in the sample electricity-usage data is an hour. -
Forecast horizon – Choose how far into the future to make predictions. This number multiplied by the data entry frequency (
hourly) that you specified inStep 1: Import the Training Datadetermines how far into the future to make predictions. For this exercise, set the number to36, to provide predictions for 36 hours. -
Forecast dimensions and Forecast quantiles – Leave the default values for these fields.
The remaining Input data configuration and Tags sections are optional, so leave the default values. The Predictor settings sections should look similar to the following:

-
-
Choose Create. Your dataset group's Dashboard page is displayed. Your screen should look similar to the following:
-
To find the status of your predictor, choose View predictors.
-
On the Predictors page find the status of your predictor in the Training status column. Your screen should look similar to the following:
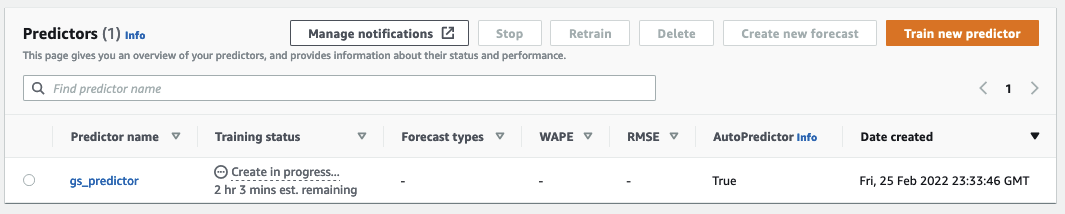
Wait for Amazon Forecast to finish training the predictor. The process can take several minutes or longer. When your predictor has been trained, the status transitions to Active and a banner displays notifying you that you can start generating forecasts.
After your predictor is Active, you can create a forecast. A forecast is a group of predictions, one for every item in the target dataset. To retrieve the complete forecast, you create an export job.
To get and view your forecast
-
On your dataset group's Dashboard, under Forecast generation, choose Start. The Create a forecast page is displayed.
Note
The
Statusof Predictor training must beActivebefore you can generate a forecast. -
On the Create a forecast page, for Forecast details, provide the following information:
-
Forecast name – Enter a name for your forecast.
-
Predictor – From the drop-down menu, choose the predictor that you created in
Step 2: Train a Predictor.
The Forecast quantiles and Tags fields are optional, so leave the default value. Your screen should look similar to the following:

Click Start.
-
-
The Forecasts page is displayed. Your screen should look similar to the following:
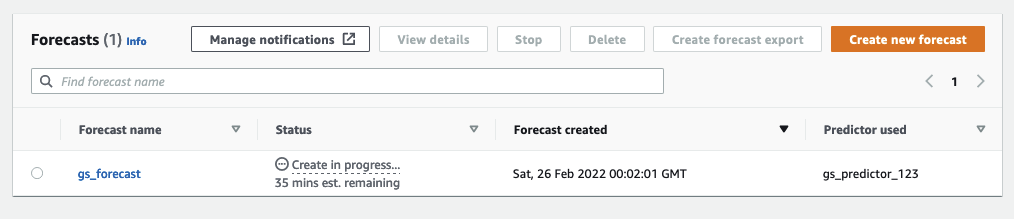
The Status column lists the status of your forecast.. Wait for Amazon Forecast to finish creating the forecast. The process can take several minutes or longer. When your forecast has been created, the status transitions to Active.
Now that your forecast has been created, you can export the forecast.
After the forecast has been created, you can export the complete forecast.
To export the complete forecast
-
On the dataset groups page, click the dataset group that you created in
Step 1: Import Training
              Data
. -
Click
 in the upper left corner of the screen to open the navigation pane. Under your dataset
group, click Forecasts.
in the upper left corner of the screen to open the navigation pane. Under your dataset
group, click Forecasts. -
Choose the radio button next to the forecast that you created in
Step 3:
              Create a Forecast
. -
Choose Create forecast export. The Create forecast export page is displayed.
-
On the Create forecast export page, for Export details, provide the following information.
-
Export name – Enter a name for your forecast export job.
-
IAM role – Keep the default Enter a custom IAM role ARN.
Alternatively, you can have Amazon Forecast create the required IAM role for you by choosing Create a new role from the drop-down menu and following the on-screen instructions.
-
Custom IAM role ARN – Enter the Amazon Resource Name (ARN) of the IAM role that you created in Create an IAM Role for Amazon Forecast (IAM Console).
-
S3 forecast export location – Use the following format to enter the location of your Amazon Simple Storage Service (Amazon S3) bucket or folder in the bucket:
s3://<name of your S3 bucket>/<folder
                path>/
Your screen should look similar to the following:

-
-
Click Start. The Forecasts page is displayed.
-
Click the forecast that you created in
Step 3: Create a Forecast. Find the Exports section. Your screen should look similar to the following:
You should see the status progress. Wait for Amazon Forecast to finish exporting the forecast. The process can take several minutes or longer. When your forecast has been exported, the status transitions to Active and you can find the forecast files in your S3 bucket.
