Monitoring
When models are already in production and delivering business value, run continuous checks to identify when models must be retrained or taken action upon.
Your monitoring team should behave proactively, not reactively, to better understand the data behavior of the environment, and to identify the frequency, rate, and abruptness of data drifts. The team should identify new edge cases in the data that might be underrepresented in the training set, validation set, and other edge case slices. They should store quality of service (QoS) metrics, use alarms to immediately take action when an issue arises, and define a strategy to ingest and amend current datasets. These practices start by logging requests and responses for the model, to provide a reference for troubleshooting or additional insights.
Ideally, data transformations should be logged in a few key stages during processing:
-
Before any kind of preprocessing
-
After any kind of feature store enrichment
-
After all main stages of a model
-
Before any kind of lossy function on the model output, such as
argmax
The following diagram illustrates these stages.
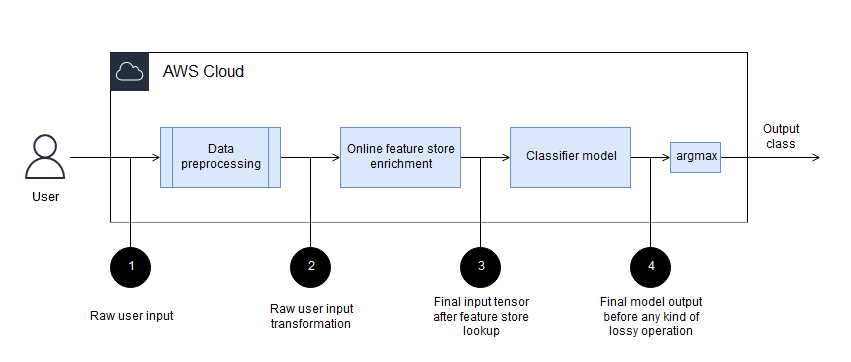
You can use SageMaker AI Model Monitor to automatically capture input and output data and store it in Amazon Simple Storage Service (Amazon S3). You can implement other types of intermediate logging by adding logs to a custom serving container.
After you log the data from models, you can monitor distribution drift. In some instances, you can get ground truth (data that’s correctly labeled) soon after inference. A common example of this is a model that predicts the most relevant ads to display to a user. As soon as the user has left the page you can determine whether they clicked the ad. If the user has clicked the ad, you might log that information. In this simple example, you can easily quantify how successful your model is by using a metric, such as accuracy or F1, that can be measured both in training and in deployment. For more information about these scenarios in which you have labeled data, see Monitor model quality in the SageMaker AI documentation. However, these simple scenarios are infrequent, because models are often designed to optimize mathematically convenient metrics that are only proxy to actual business outcomes. In such cases, the best practice is to monitor the business outcome when a model is deployed in production.
Consider the case of a review ranking model. If the defined business outcome of the ML model is to display the most relevant and useful reviews at the top of the webpage, you can measure the success of the model by adding a button such as "Was this helpful?" for each review. Measuring the clickthrough rate of this button could be a business outcome measure that helps you measure how well your model is doing in production.
To monitor the drift of the input or output labels in SageMaker AI, you can use the data
quality capabilities of SageMaker AI Model Monitor, which monitor both the input and output.
You can also implement your own logic for SageMaker AI Model Monitor by building a custom container
Monitoring the data that a model receives both in development time and in runtime is critical. Engineers should monitor the data not only for schema changes but also for distribution mismatches. Detecting schema changes is easier and can be implemented by a set of rules, but distribution mismatch is often trickier, especially because it requires you to define a threshold to quantify when to raise an alarm. In cases where the monitored distribution is known, often the easiest way is to monitor the distribution's parameters. In the case of a normal distribution, that would be the mean and standard deviation. Other key metrics, such as the percentage of missing values, maximum values, and minimum values, are also useful.
You can also create ongoing monitoring jobs that sample training data and inference data and compare their distributions. You can create these jobs for both model input and model output, and plot the data against time to visualize any sudden or gradual drift. This is illustrated in the following chart.
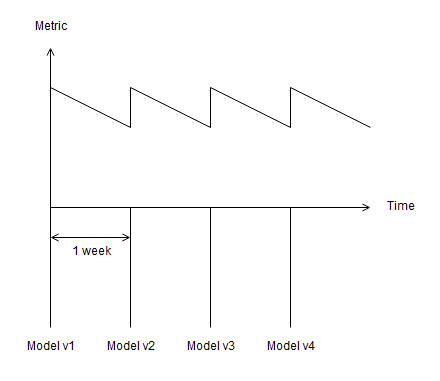
To better understand the drift profile of the data, such as how often the data distribution significantly changes, at what rate, or how sudden, we recommend that you continuously deploy new model versions and monitor their performance. For example, if your team deploys a new model every week and observes that the model performance significantly improves every time, they can determine that they should deliver new models in less than a week at the minimum.
