Optimize the performance of your AWS Blu Age modernized application
Vishal Jaswani, Manish Roy, and Himanshu Sah, Amazon Web Services
Summary
Mainframe applications that are modernized with AWS Blu Age require functional and performance equivalence testing before they’re deployed to production. In performance tests, modernized applications can perform more slowly than legacy systems, particularly in complex batch jobs. This disparity exists because mainframe applications are monolithic, whereas modern applications use multitier architectures. This pattern presents optimization techniques to address these performance gaps for applications that are modernized by using automated refactoring with AWS Blu Age.
The pattern uses the AWS Blu Age modernization framework with native Java and database tuning capabilities to identify and resolve performance bottlenecks. The pattern describes how you can use profiling and monitoring to identify performance issues with metrics such as SQL execution times, memory utilization, and I/O patterns. It then explains how you can apply targeted optimizations, including database query restructuring, caching, and business logic refinement.
The improvements in batch processing times and system resource utilization help you match mainframe performance levels in your modernized systems. This approach maintains functional equivalence during transition to modern cloud-based architectures.
To use this pattern, set up your system and identify performance hotspots by following the instructions in the Epics section, and apply the optimization techniques that are covered in detail in the Architecture section.
Prerequisites and limitations
Prerequisites
An AWS Blu Age modernized application
Administrative privileges to install database client and profiling tools
AWS Blu Age Level 3 certification
Intermediate-level understanding of the AWS Blu Age framework, generated code structure, and Java programming
Limitations
The following optimization capabilities and features are outside the scope of this pattern:
Network latency optimization between application tiers
Infrastructure-level optimizations through Amazon Elastic Compute Cloud (Amazon EC2) instance types and storage optimization
Concurrent user load testing and stress testing
Product versions
JProfiler version 13.0 or later (we recommend the latest version)
pgAdmin version 8.14 or later
Architecture
This pattern sets up a profiling environment for an AWS Blu Age application by using tools such as JProfiler and pgAdmin. It supports optimization through the DAOManager and SQLExecutionBuilder APIs provided by AWS Blu Age.
The remainder of this section provides detailed information and examples for identifying performance hotspots and optimization strategies for your modernized applications. The steps in the Epics section refer back to this information for further guidance.
Identifying performance hotspots in modernized mainframe applications
In modernized mainframe applications, performance hotspots are specific areas in the code that cause significant slowdowns or inefficiencies. These hotspots are often caused by the architectural differences between mainframe and modernized applications. To identify these performance bottlenecks and optimize the performance of your modernized application, you can use three techniques: SQL logging, a query EXPLAIN plan, and JProfiler analysis.
Hotspot identification technique: SQL logging
Modern Java applications, including those that have been modernized by using AWS Blu Age, have built-in capabilities to log SQL queries. You can enable specific loggers in AWS Blu Age projects to track and analyze the SQL statements executed by your application. This technique is particularly useful for identifying inefficient database access patterns, such as excessive individual queries or poorly structured database calls, that could be optimized through batching or query refinement.
To implement SQL logging in your AWS Blu Age modernized application, set the log level to DEBUG for SQL statements in the application.properties file to capture query execution details:
level.org.springframework.beans.factory.support.DefaultListableBeanFactory : WARN
level.com.netfective.bluage.gapwalk.runtime.sort.internal: WARN
level.org.springframework.jdbc.core.StatementCreatorUtils: DEBUG
level.com.netfective.bluage.gapwalk.rt.blu4iv.dao: DEBUG
level.com.fiserv.signature: DEBUG
level.com.netfective.bluage.gapwalk.database.support.central: DEBUG
level.com.netfective.bluage.gapwalk.rt.db.configuration.DatabaseConfiguration: DEBUG
level.com.netfective.bluage.gapwalk.rt.db.DatabaseInteractionLoggerUtils: DEBUG
level.com.netfective.bluage.gapwalk.database.support.AbstractDatabaseSupport: DEBUG
level.com.netfective.bluage.gapwalk.rt: DEBUG
Monitor high-frequency and slow-performing queries by using the logged data to identify optimization targets. Focus on queries within batch processes because they typically have the highest performance impact.
Hotspot identification technique: Query EXPLAIN plan
This method uses the query planning capabilities of relational database management systems. You can use commands such as EXPLAIN in PostgreSQL or MySQL, or EXPLAIN PLAN in Oracle, to examine how your database intends to run a given query. The output of these commands provides valuable insights into the query execution strategy, including whether indexes will be used or full table scans will be performed. This information is critical for optimizing query performance, especially in cases where proper indexing can significantly reduce execution time.
Extract the most repetitive SQL queries from the application logs and analyze the execution path of slow-performing queries by using the EXPLAIN command that’s specific to your database. Here’s an example for a PostgreSQL database.
Query:
SELECT * FROM tenk1 WHERE unique1 < 100;
EXPLAIN command:
EXPLAIN SELECT * FROM tenk1 where unique1 < 100;
Output:
Bitmap Heap Scan on tenk1 (cost=5.06..224.98 rows=100 width=244)
Recheck Cond: (unique1 < 100)
-> Bitmap Index Scan on tenk1_unique1 (cost=0.00..5.04 rows=100 width=0)
Index Cond: (unique1 < 100)
You can interpret the EXPLAIN output as follows:
Read the
EXPLAINplan from the innermost to the outermost (bottom to top) operations.Look for key terms. For example,
Seq Scanindicates full table scan andIndex Scanshows index usage.Check cost values: The first number is the startup cost, and the second number is the total cost.
See the
rowsvalue for the estimated number of output rows.
In this example, the query engine uses an index scan to find the matching rows, and then fetches only those rows (Bitmap Heap Scan). This is more efficient than scanning the entire table, despite the higher cost of individual row access.
Table scan operations in the output of an EXPLAIN plan indicate a missing index. Optimization requires the creation of an appropriate index.
Hotspot identification technique: JProfiler analysis
JProfiler is a comprehensive Java profiling tool that helps you resolve performance bottlenecks by identifying slow database calls and CPU-intensive calls. This tool is particularly effective in identifying slow SQL queries and inefficient memory usage.
Example analysis for query:
select evt. com.netfective.bluage.gapwalk.rt.blu4iv.dao.Blu4ivTableManager.queryNonTrasactional
The JProfiler Hot Spots view provides the following information:
Time column
Shows total execution duration (for example, 329 seconds)
Displays percentage of total application time (for example, 58.7%)
Helps identify most time-consuming operations
Average Time column
Shows per-execution duration (for example, 2,692 microseconds)
Indicates individual operation performance
Helps spot slow individual operations
Events column
Shows execution count (for example, 122,387 times)
Indicates operation frequency
Helps identify frequently called methods
For the example results:
High frequency: 122,387 executions indicate potential for optimization
Performance concern: 2,692 microseconds for average time suggests inefficiency
Critical impact: 58.7% of total time indicates major bottleneck
JProfiler can analyze your application's runtime behavior to reveal hotspots that might not be apparent through static code analysis or SQL logging. These metrics help you identify the operations that need optimization and determine the optimization strategy that would be most effective. For more information about JProfiler features, see the JProfiler documentation
When you use these three techniques (SQL logging, query EXPLAIN plan, and JProfiler) in combination, you can gain a holistic view of your application's performance characteristics. By identifying and addressing the most critical performance hotspots, you can bridge the performance gap between your original mainframe application and your modernized cloud-based system.
After you identify your application’s performance hotspots, you can apply optimization strategies, which are explained in the next section.
Optimization strategies for mainframe modernization
This section outlines key strategies for optimizing applications that have been modernized from mainframe systems. It focuses on three strategies: using existing APIs, implementing effective caching, and optimizing business logic.
Optimization strategy: Using existing APIs
AWS Blu Age provides several powerful APIs in DAO interfaces that you can use to optimize performance. Two primary interfaces—DAOManager and SQLExecutionBuilder—offer capabilities for enhancing application performance.
DAOManager
DAOManager serves as the primary interface for database operations in modernized applications. It offers multiple methods to enhance database operations and improve application performance, particularly for straightforward create, read, update, and delete (CRUD) operations and batch processing.
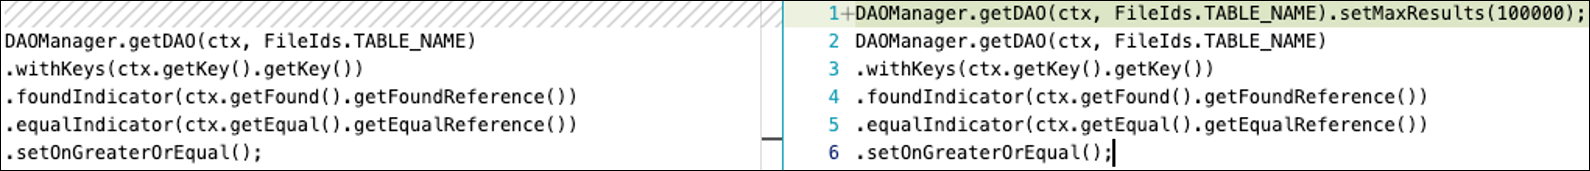
Use SetMaxResults. In the DAOManager API, you can use the SetMaxResults method to specify the maximum number of records to retrieve in a single database operation. By default, DAOManager retrieves only 10 records at a time, which can lead to multiple database calls when processing large datasets. Use this optimization when your application needs to process a large number of records and is currently making multiple database calls to retrieve them. This is particularly useful in batch processing scenarios where you're iterating through a large dataset. In the following example, the code on the left (before optimization) uses the default data retrieval value of 10 records. The code on the right (after optimization) sets setMaxResults to retrieve 100,000 records at a time.
Note
Choose larger batch sizes carefully and check object size, because this optimization increases the memory footprint.
Replace SetOnGreatorOrEqual with SetOnEqual. This optimization involves changing the method you use to set the condition for retrieving records. The SetOnGreatorOrEqual method retrieves records that are greater than or equal to a specified value, whereas SetOnEqual retrieves only records that exactly match the specified value.
Use SetOnEqual as illustrated in the following code example, when you know that you need exact matches and you're currently using the SetOnGreatorOrEqual method followed by readNextEqual(). This optimization reduces unnecessary data retrieval.

Use batch write and update operations. You can use batch operations to group multiple write or update operations into a single database transaction. This reduces the number of database calls and can significantly improve performance for operations that involve multiple records.
In the following example, the code on the left performs write operations in a loop, which slows down the application’s performance. You can optimize this code by using a batch write operation: During each iteration of the
WHILEloop, you add records to a batch until the batch size reaches a predetermined size of 100. You can then flush the batch when it reaches the predetermined batch size, and then flush any remaining records to the database. This is particularly useful in scenarios where you process large datasets that require updates.
Add indexes. Adding indexes is a database-level optimization that can significantly improve query performance. An index allows the database to quickly locate rows with a specific column value without scanning the entire table. Use indexing on columns that are frequently used in
WHEREclauses,JOINconditions, orORDER BYstatements. This is particularly important for large tables or when quick data retrieval is crucial.
SQLExecutionBuilder
SQLExecutionBuilder is a flexible API that you can use to take control of the SQL queries that will be executed, fetch certain columns only, INSERT by using SELECT, and use dynamic table names. In the following example, SQLExecutorBuilder uses a custom query that you define.

Choosing between DAOManager and SQLExecutionBuilder
The choice between these APIs depends on your specific use case:
Use DAOManager when you want AWS Blu Age Runtime to generate the SQL queries instead of writing them yourself.
Choose SQLExecutionBuilder when you need to write SQL queries to take advantage of database-specific features or write optimal SQL queries.
Optimization strategy: Caching
In modernized applications, implementing effective caching strategies can significantly reduce database calls and improve response times. This helps bridge the performance gap between mainframe and cloud environments.
In AWS Blu Age applications, simple caching implementations use internal data structures such as hash maps or array lists, so you don’t have to set up an external caching solution that requires cost and code restructuring. This approach is particularly effective for data that is accessed frequently but changes infrequently. When you implement caching, consider memory constraints and update patterns to ensure that the cached data remains consistent and provides actual performance benefits.
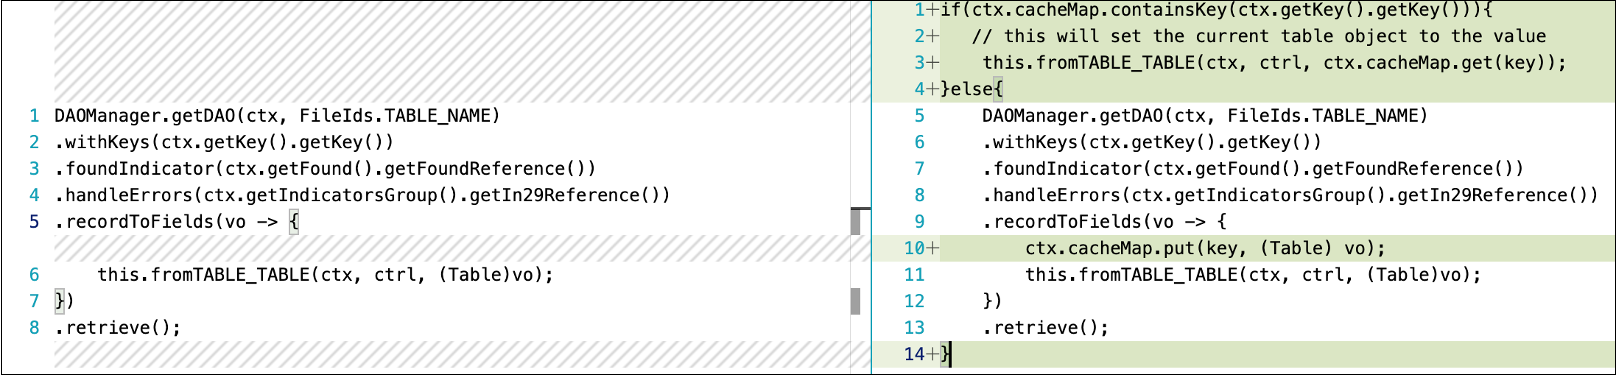
The key to successful caching is identifying the right data to cache. In the following example, the code on the left always reads data from the table, whereas the code on the right reads data from the table when the local hash map doesn’t have a value for a given key. cacheMap is a hash map object that’s created in the context of the program and cleared in the cleanup method of the program context.
Caching with DAOManager:
Caching with SQLExecutionBuilder:

Optimization strategy: Business logic optimization
Business logic optimization focuses on restructuring automatically generated code from AWS Blu Age to better align with modern architecture capabilities. This becomes necessary when the generated code maintains the same logic structure as the legacy mainframe code, which may not be optimal for modern systems. The goal is to improve performance while maintaining functional equivalence with the original application.
This optimization approach goes beyond simple API tweaks and caching strategies. It involves changes to how the application processes data and interacts with the database. Common optimizations include avoiding unnecessary read operations for simple updates, removing redundant database calls, and restructuring data access patterns to better align with modern application architecture. Here are a few examples:
Updating data directly in the database. Restructure your business logic by using direct SQL updates instead of multiple DAOManager operations with loops. For example, the following code (left side) makes multiple database calls and uses excessive memory. Specifically, it uses multiple database read and write operations within loops, individual updates instead of batch processing, and unnecessary object creation for each iteration.
The following optimized code (right side) uses a single Direct SQL update operation. Specifically, it uses a single database call instead of multiple calls and doesn’t require loops because all updates are handled in a single statement. This optimization provides better performance and resource utilization, and reduces complexity. It prevents SQL injection, provides better query plan caching, and helps improve security.

Note
Always use parameterized queries to prevent SQL injection and ensure proper transaction management.
Reducing redundant database calls. Redundant database calls can significantly impact application performance, particularly when they occur within loops. A simple but effective optimization technique is to avoid repeating the same database query multiple times. The following code comparison demonstrates how moving the
retrieve()database call outside the loop prevents redundant execution of identical queries, which improves efficiency.
Reducing database calls by using the SQL
JOINclause. Implement SQLExecutionBuilder to minimize the calls to the database. SQLExecutionBuilder provides more control over SQL generation and is particularly useful for complex queries that DAOManager cannot handle efficiently. For example, the following code uses multiple DAOManager calls:List<Employee> employees = daoManager.readAll(); for(Employee emp : employees) { Department dept = deptManager.readById(emp.getDeptId()); // Additional call for each employee Project proj = projManager.readById(emp.getProjId()); // Another call for each employee processEmployeeData(emp, dept, proj); }The optimized code uses a single database call in SQLExecutionBuilder:
SQLExecutionBuilder builder = new SQLExecutionBuilder();
builder.append("SELECT e.*, d.name as dept_name, p.name as proj_name");
builder.append("FROM employee e");
builder.append("JOIN department d ON e.dept_id = d.id");
builder.append("JOIN project p ON e.proj_id = p.id");
builder.append("WHERE e.status = ?", "ACTIVE");

List<Map<String, Object>> results = builder.execute();  // Single database call
for(Map<String, Object> result : results) {
    processComplexData(result);
}
Using optimization strategies together
These three strategies work synergistically: APIs provide the tools for efficient data access, caching reduces the need for repeated data retrieval, and business logic optimization ensures that these APIs are used in the most effective way possible. Regular monitoring and adjustment of these optimizations ensure continued performance improvements while maintaining the reliability and functionality of the modernized application. The key to success lies in understanding when and how to apply each strategy based on your application’s characteristics and performance goals.
Tools
JProfiler
is a Java profiling tool that’s designed for developers and performance engineers. It analyzes Java applications and helps identify performance bottlenecks, memory leaks, and threading issues. JProfiler offers CPU, memory, and thread profiling as well as database and Java virtual machine (JVM) monitoring to provide insights into application behavior. Note
As an alternative to JProfiler, you can use Java VisualVM
. This is a free, open source performance profiling and monitoring tool for Java applications that offers real-time monitoring of CPU usage, memory consumption, thread management, and garbage collection statistics. Because Java VisualVM is a built-in JDK tool, it is more cost-effective than JProfiler for basic profiling needs. pgAdmin
is an open source administration and development tool for PostgreSQL. It provides a graphical interface that helps you create, maintain, and use database objects. You can use pgAdmin to perform a wide range of tasks, from writing simple SQL queries to developing complex databases. Its features include a syntax highlighting SQL editor, a server-side code editor, a scheduling agent for SQL, shell, and batch tasks, and support for all PostgreSQL features for both novice and experienced PostgreSQL users.
Best practices
Identifying performance hotspots:
Document baseline performance metrics before you start optimizations.
Set clear performance improvement targets based on business requirements.
When benchmarking, disable verbose logging, because it can affect performance.
Set up a performance test suite and run it periodically.
Use the latest version of pgAdmin. (Older versions don't support the
EXPLAINquery plan.)For benchmarking, detach JProfiler after your optimizations are complete because it adds to latency.
For benchmarking, make sure to run the server in start mode instead of debug mode, because debug mode adds to latency.
Optimization strategies:
Configure SetMaxResults values in the
application.yamlfile, to specify right-sized batches according to your system specifications.Configure SetMaxResults values based on data volume and memory constraints.
Change SetOnGreatorOrEqual to SetOnEqual only when subsequent calls are
.readNextEqual().In batch write or update operations, handle the last batch separately, because it might be smaller than the configured batch size and could be missed by the write or update operation.
Caching:
Fields that are introduced for caching in
processImpl, which mutate with each execution, should always be defined in the context of thatprocessImpl. The fields should also be cleared by using thedoReset()orcleanUp()method.When you implement in-memory caching, right-size the cache. Very large caches that are stored in memory can take up all the resources, which might affect the overall performance of your application.
SQLExecutionBuilder:
For queries that you are planning to use in SQLExecutionBuilder, use key names such as
PROGRAMNAME_STATEMENTNUMBER.When you use SQLExecutionBuilder, always check for the
Sqlcodfield. This field contains a value that specifies whether the query was executed correctly or encountered any errors.Use parameterized queries to prevent SQL injection.
Business logic optimization:
Maintain functional equivalence when restructuring code, and run regression testing and database comparison for the relevant subset of programs.
Maintain profiling snapshots for comparison.
Epics
| Task | Description | Skills required |
|---|---|---|
Install and configure JProfiler. |
| App developer |
Install and configure pgAdmin. | In this step, you install and configure a DB client to query your database. This pattern uses a PostgreSQL database and pgAdmin as a database client. If you are using another database engine, follow the documentation for the corresponding DB client.
| App developer |
| Task | Description | Skills required |
|---|---|---|
Enable SQL query logging in your AWS Blu Age application. | Enable the loggers for SQL query logging in the | App developer |
Generate and analyze query | For details, see the Architecture section. | App developer |
Create a JProfiler snapshot to analyze a slow-performing test case. |
| App developer |
Analyze the JProfiler snapshot to identify performance bottlenecks. | Follow these steps to analyze the JProfiler snapshot.
For more information about using JProfiler, see the Architecture section and the JProfiler documentation | App developer |
| Task | Description | Skills required |
|---|---|---|
Establish a performance baseline before you implement optimizations. |
| App developer |
| Task | Description | Skills required |
|---|---|---|
Optimize read calls. | Optimize data retrieval by using the DAOManager SetMaxResults method. For more information about this approach, see the Architecture section. | App developer, DAOManager |
Refactor the business logic to avoid multiple calls to the database. | Reduce database calls by using a SQL | App developer, SQLExecutionBuilder |
Refactor the code to use caching to reduce the latency of read calls. | For information about this technique, see Caching in the Architecture section. | App developer |
Rewrite inefficient code that uses multiple DAOManager operations for simple update operations. | For more information about updating data directly in the database, see Business logic optimization in the Architecture section. | App developer |
| Task | Description | Skills required |
|---|---|---|
Validate each optimization change iteratively while maintaining functional equivalence. |
NoteUsing baseline metrics as a reference ensures accurate measurement of each optimization's impact while maintaining system reliability. | App developer |
Troubleshooting
| Issue | Solution |
|---|---|
When you run the modern application, you see an exception with the error | To resolve this issue:
|
You’ve added indexes, but you don’t see any performance improvements. | Follow these steps to ensure that the query engine is using the index:
|
You encounter an out-of-memory exception. | Verify that the code releases the memory held by the data structure. |
Batch write operations result in missing records in the table | Review the code to ensure that an additional write operation is performed when the batch count isn’t zero. |
SQL logging doesn’t appear in application logs. |
|
Related resources
Refactoring applications automatically with AWS Blu Age (AWS Mainframe Modernization User Guide)
